
Report Wizard - Data-bound Report
NOTEThe default Report Designer implementation uses the Report Wizard (Fullscreen) version. To use the popup version instead, disable the
ReportDesignerWizardSettings.UseFullscreenWizardoption.
Selecting the Data-bound Report option on the Choose a Report Type wizard page enables you to create a new report, bind it to data and define the report layout.
Choose a Data Source
NOTEThe default Report Designer implementation uses the Report Wizard (Fullscreen) version. To use the popup version instead, disable the ReportDesignerWizardSettings.UseFullscreenWizard option.
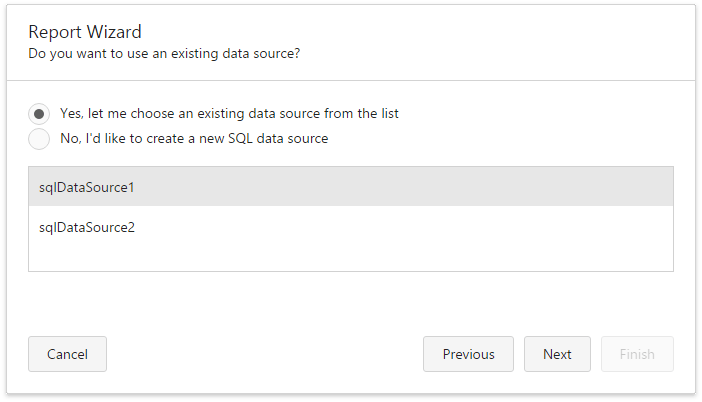
On this wizard page, you can select an available data source or create a new one to assign to the report.
Selecting an Existing Data Source
To use an existing data source, select the first option and choose the required item from the list.
- If you invoke the Report Wizard by selecting the New via Wizard command in the Report Designer Menu, this list displays data sources defined as default data sources.
- If you invoke the Report Wizard by selecting the Design in Report Wizard menu command, the list contains data sources defined for the Report Designer as default data sources, as well as data sources added to the report using the SQL Data Source Wizard.
When the report and report designer have data sources with identical names, this page displays the report’s data source.
Click Next to proceed to the next wizard page: Choose Columns (Multi-Query Version).
Creating a New Data Source
To create a new data source, select the second option on this page.
In this case, you follow the steps in the SQL Data Source Wizard to add a new data source and then proceed to the Choose Columns (Multi-Query Version) page on completion.
NOTECreating a new data source is only available if you provided the Web Report Designer with default data connections.
Choose Columns (Multi-Query Version)
NOTEThe default Report Designer implementation uses the Report Wizard (Fullscreen) version. To use the popup version instead, disable the
ReportDesignerWizardSettings.UseFullscreenWizardoption.
This wizard page allows you to select data members for a report and its detail reports, as well as choose data fields to display in these reports.
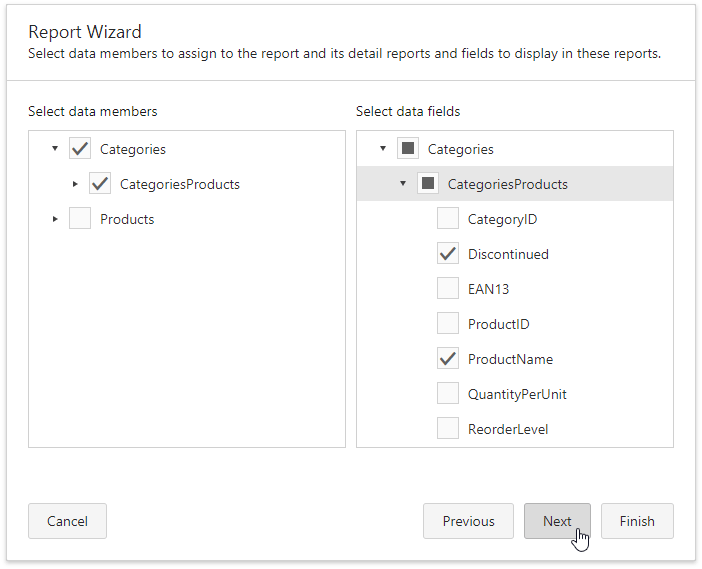
The list on the left-hand side displays available queries and master-detail relationships. Select the required checkboxes to create relevant reports and assign their DataMember property.
In the list on the right-hand side, choose data fields from the selected data members to include them in corresponding reports.
After completing the wizard, the report is constructed according to the following rules:
- If you select one query, it is assigned to the report’s
XtraReportBase.DataMemberproperty. The selected fields with their corresponding captions are automatically added to the report’s Detail Band. - If you select two or more queries, this creates the Detail Report Band for each query at the same hierarchical level. These detail reports’ DataMember properties are assigned to the corresponding queries.
- For each selected master-detail relationship, the Detail Report Band with the DataMember property set to this relationship is created under the corresponding master report.
You can stop the wizard at this step by clicking Finish. The created report looks similar to the image below.****

If you want to customize the report further, click Next to go to the Create Groups (Multi-Query Version) page.
Choose a Table or View (Single-Query Version)
NOTEThis wizard page is no longer used. The default Report Designer implementation uses the Report Wizard (Fullscreen) version.
You can switch back to using the standard Report Wizard version in your Web application by disabling the
ReportDesignerWizardSettings.UseMasterDetailWizardoption.
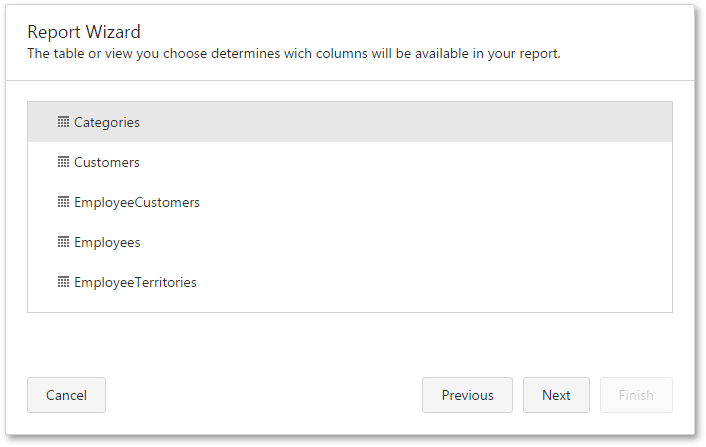
This page becomes available if the current data source contains two or more data members.
On this page, select a data table or view to use as the report data member and provide data to the report.
Choose Columns (Single-Query Version)
NOTEThis wizard page is no longer used. The default Report Designer implementation uses the Report Wizard (Fullscreen) version.
You can switch back to using the standard Report Wizard version in your Web application by disabling the
ReportDesignerWizardSettings.UseMasterDetailWizardoption.
On this page, you can choose fields whose data will be displayed in your report. The selected fields and corresponding captions will be automatically added to the report body.
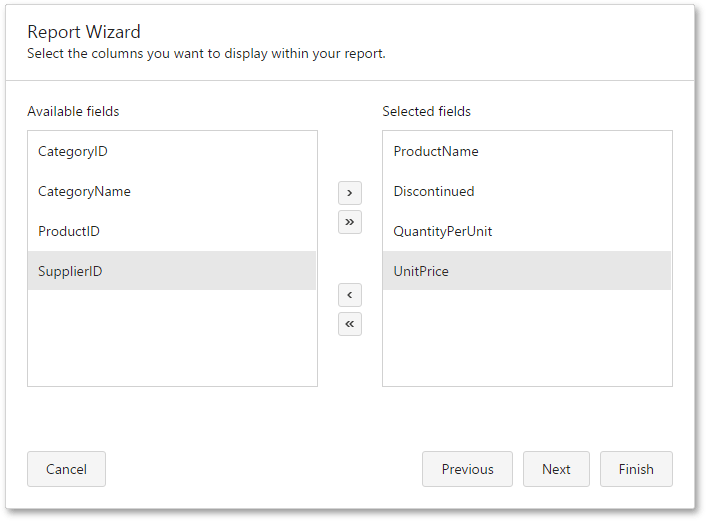
You can stop the wizard at this step by clicking Finish.
The selected fields with corresponding captions will be automatically added to the created report and arranged one under another (in the order they were selected in the wizard).

To continue report customization, select at least one field and click Next to proceed to the next wizard page: Create Groups (Single-Query Version).
Create Groups (Multi-Query Version)
NOTEThe default Report Designer implementation uses the Report Wizard (Fullscreen) version. To use the popup version instead, disable the
ReportDesignerWizardSettings.UseFullscreenWizardoption.
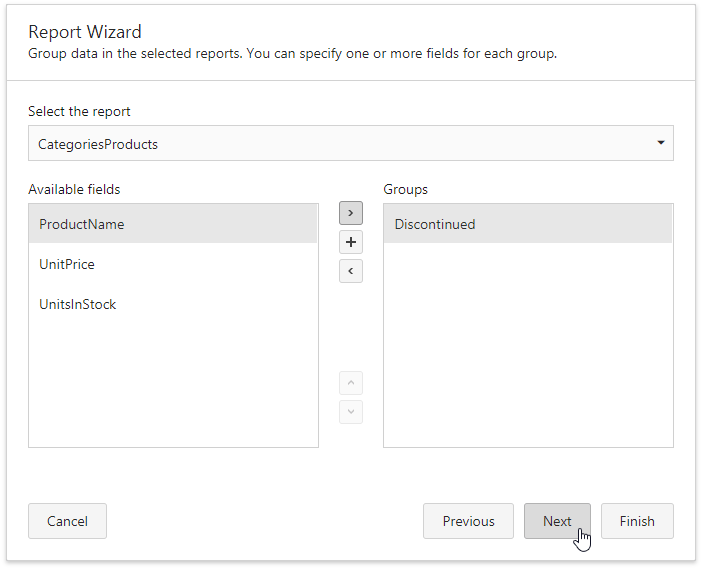
This wizard page allows you to group data in the selected reports. You can skip this step by clicking Next if grouping is not required.
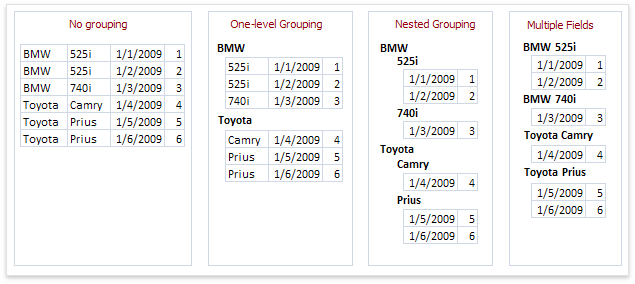
The following image illustrates supported grouping types:
Use the drop-down list at the top of the wizard page to select a required report.
The list on the left-hand side displays data fields that can be used to group data in the selected report. You can apply grouping by double-clicking the required field, or selecting it and clicking the right arrow button. Use the  button to group data against multiple columns.
To remove a grouping field, double-click it in the list on the right-hand side, or select it and click the left arrow button. You can also change the grouping fields’ order using the up arrow and down arrow buttons.
You can stop the wizard on this step by clicking Finish. In this case, the report looks similar to the image below.

If you want to customize the report further, click Next to proceed to the Choose Summary Options (Multi-Query Version) page.
Create Groups (Single-Query Version)
NOTEThis wizard page is no longer used. The default Report Designer implementation uses the Report Wizard (Fullscreen) version.
On this page, you can create groups in your report. When this is not required, you can skip this page by clicking Next.
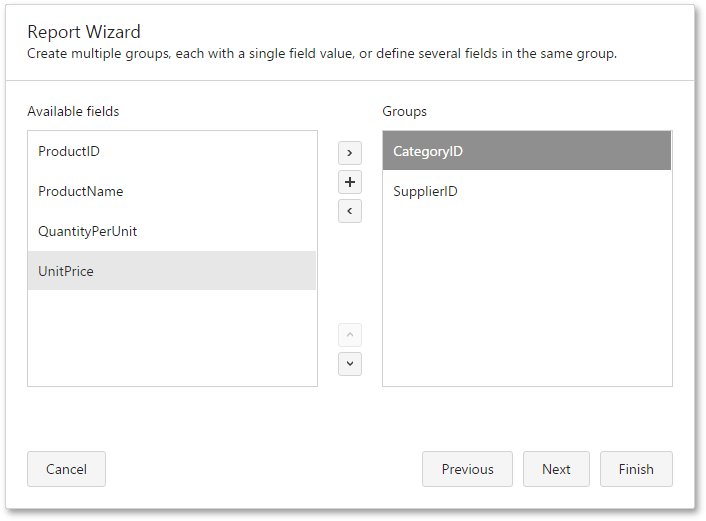
The following image illustrates how nested grouping and grouping against multiple fields work.
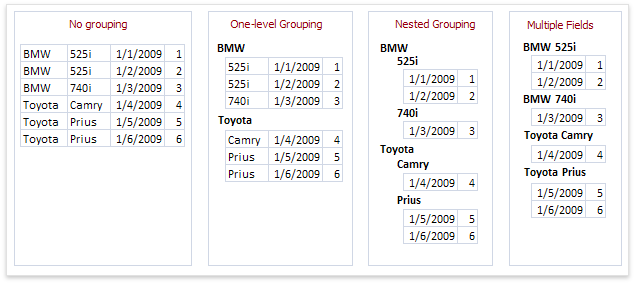
You can stop the wizard at this step by clicking Finish.
To continue report customization, click Next to proceed to the next wizard page.
- If data grouping has been applied on this page, you will proceed to the Choose Summary Options (Single-Query Version) page.
- If you have not grouped your data, you will proceed to the Choose a Report Layout page.
Choose Summary Options (Multi-Query Version)
NOTEThe default Report Designer implementation uses the Report Wizard (Fullscreen) version. To use the popup version instead, disable the
ReportDesignerWizardSettings.UseFullscreenWizardoption.
On this wizard page, you can specify summaries to calculate in the selected reports.
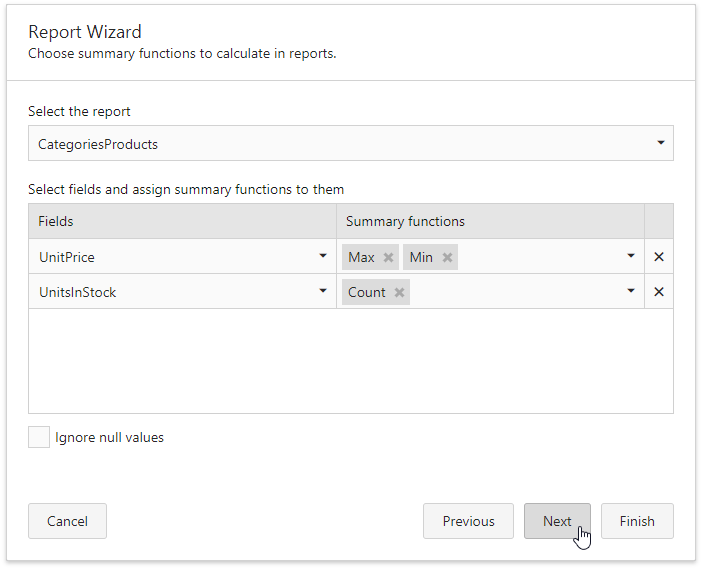
Use the drop-down list at the top of the wizard page to choose the required report.
In the Fields table column, you can select an available numerical or date-time field. In the Summary functions drop-down, specify which functions should be calculated for the selected field by enabling the corresponding checkboxes.
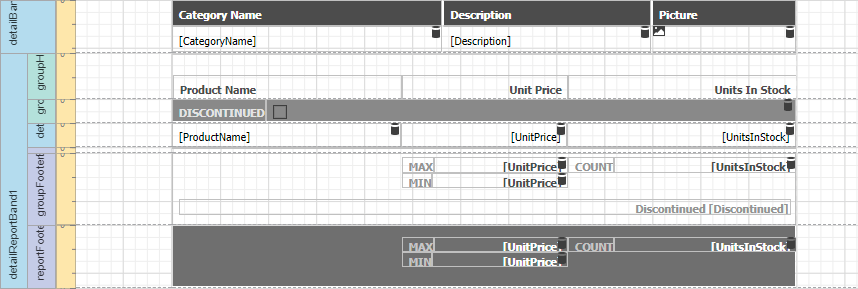
The specified summaries are displayed in the report footer and after the corresponding groups (if you grouped report data on the previous wizard page).
Select the Ignore null valuescheckbox if data fields can contain empty values and you do not want to take these values into account when calculating totals. Otherwise, these values are treated as zeros for numeric fields and the earliest system date for date-time fields.
You can stop the wizard at this step by clicking Finish. The created report looks like the following image:
If you want to customize the report further, click Next to proceed to the next wizard page: Specify the Report Title.
Choose Summary Options (Single-Query Version)
NOTEThis wizard page is no longer used. The default Report Designer implementation uses the Report Wizard (Fullscreen) version.
You can switch back to using the standard Report Wizard version in your Web application by disabling the
ReportDesignerWizardSettings.UseMasterDetailWizardoption.
This page is displayed if groups were specified on the previous wizard page: Create Groups (Single-Query Version).
On this page, you can choose the totals to calculate in your report. The selected totals will be calculated across each group (these totals will be displayed in corresponding group footers) and the grand total will be calculated across the entire report (these totals will be displayed in the report footer).
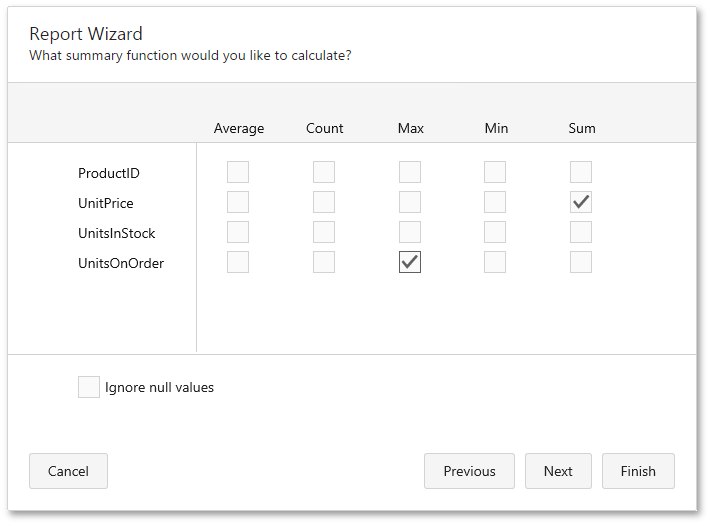
This page displays all numerical and date-time fields that are added to the report and not used as grouping criteria.
To discard empty database records when calculating totals, enable the Ignore NULL values check box. Otherwise, empty values will be treated as zeros for numeric fields and the earliest system date for date-time fields.
You can stop the wizard at this step by clicking Finish.
To continue report customization, click Next to proceed to the next wizard page: Choose a Report Layout.
Choose a Report Layout
NOTEThis wizard page is no longer used. The default Report Designer implementation uses the Report Wizard (Fullscreen) version.
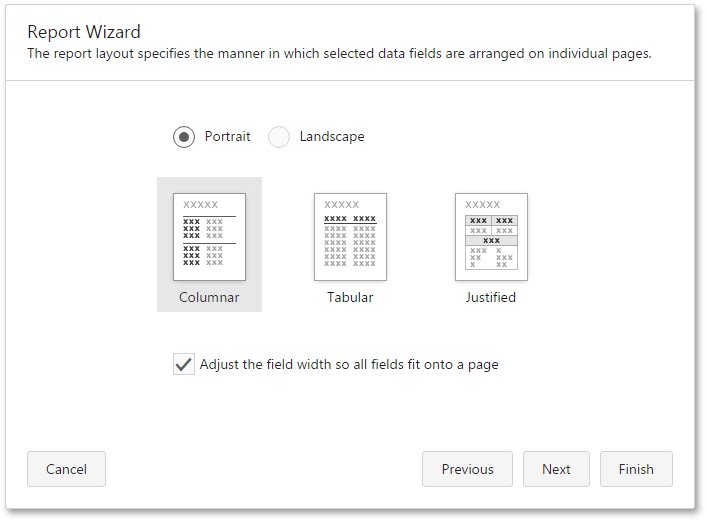
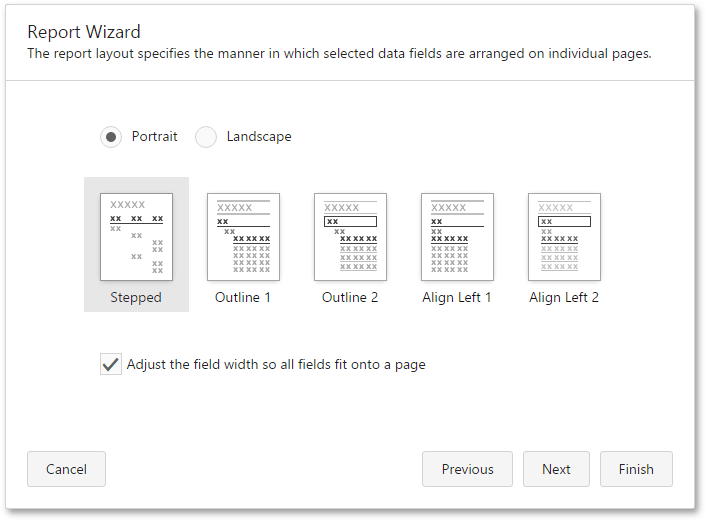
On this page, you can specify the layout of elements in your report that correspond to the selected page’s orientation. Different layouts are available depending on whether or not any groups were defined for the report on the Create Groups (Single-Query Version) wizard page.
- If report data is not grouped, you will see the following report layout options on this page.
- If the report data is grouped, the following layouts are available (defining visual styles for nested report elements).
You can stop the wizard at this step by clicking Finish.
To continue report customization, click Next to proceed to the next wizard page: Choose a Report Style.
Choose a Report Style
NOTEThis wizard page is no longer used. The default Report Designer implementation uses the Report Wizard (Fullscreen) version.
You can switch back to using the standard Report Wizard version in your Web application by disabling the
ReportDesignerWizardSettings.UseMasterDetailWizardoption.
On this page, you can specify a visual style for the report.
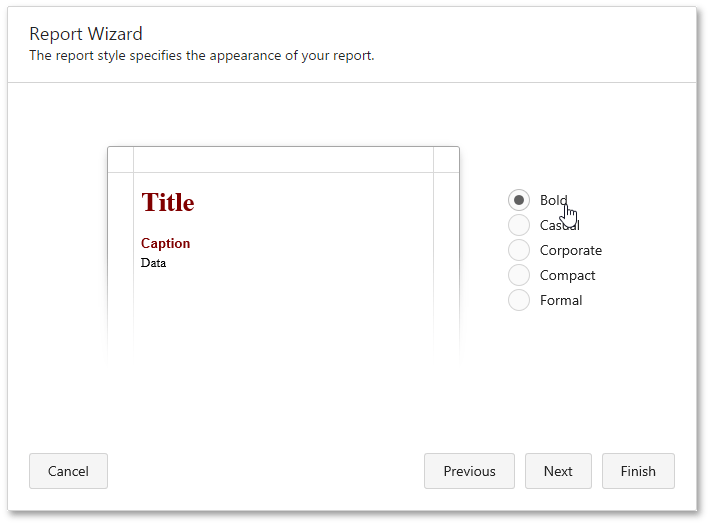
The following styles are available on this page.
- Bold
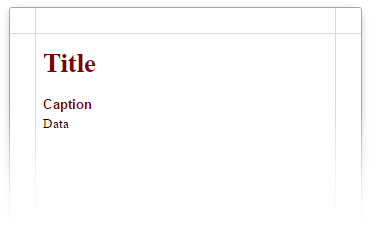
- Casual
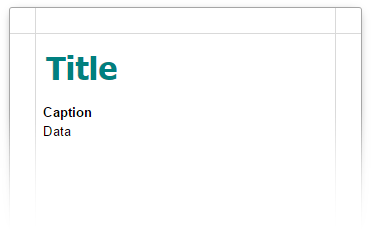
- Corporate
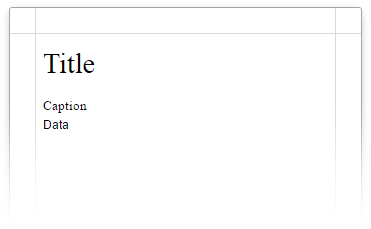
- Compact
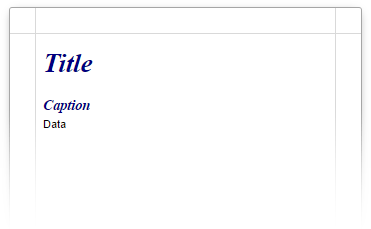
- Formal
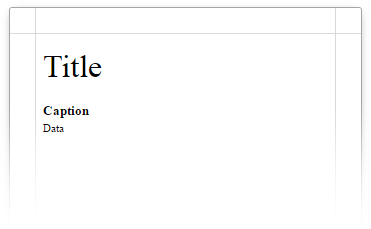
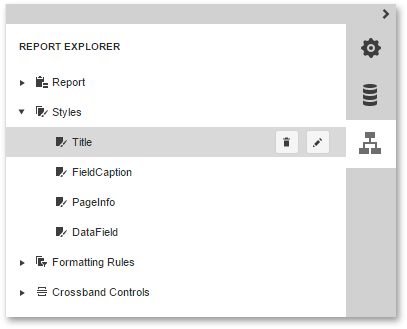
After the report is created, you can customize styles corresponding to different report elements in the Report Explorer.
You can stop the wizard at this step by clicking Finish.
To continue report customization, Stay on this page: Specify the Report Title.
Specify the Report Title
NOTEThe default Report Designer implementation uses the Report Wizard (Fullscreen) version. To use the popup version instead, disable the
ReportDesignerWizardSettings.UseFullscreenWizardoption.
On this page, you can specify the title for the report.
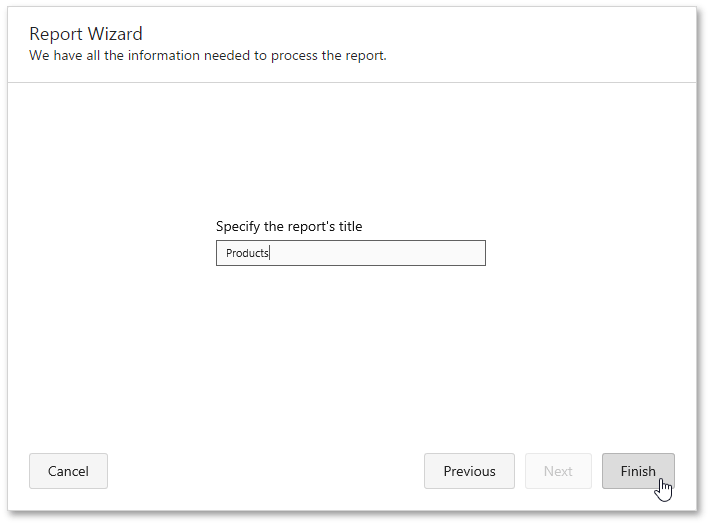
Click Finish to exit the wizard and create a report based on the specified settings.
Updated 7 months ago