
Creating a Dashboard
Creating a dashboard in Compyl allows you to visualize and manage your compliance and security data effectively. This module can be found on the left side menu of the Compyl home page.
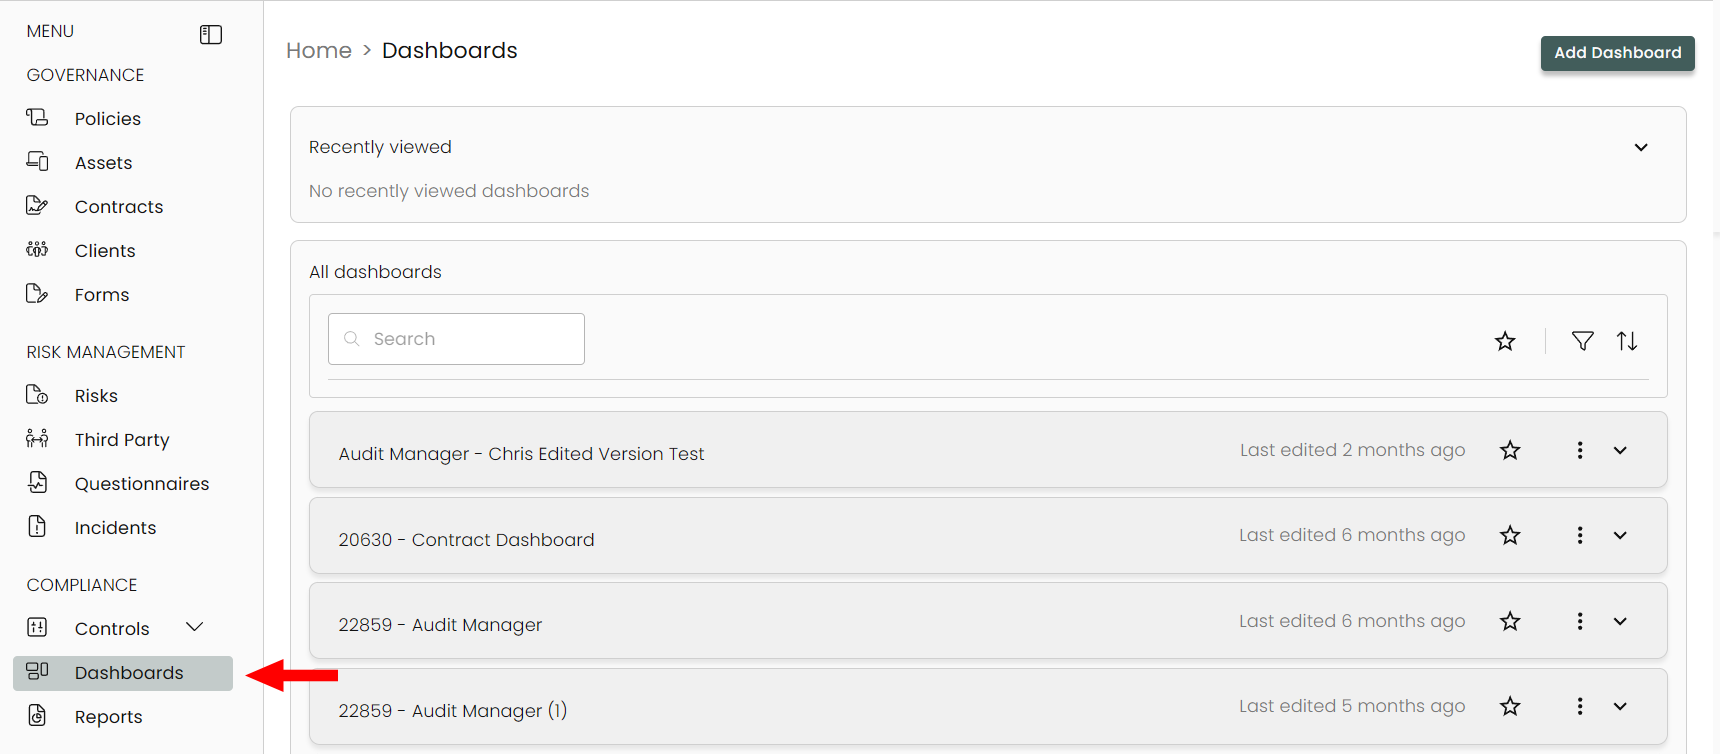
Create a New Dashboard
-
Click on Add Dashboard.

-
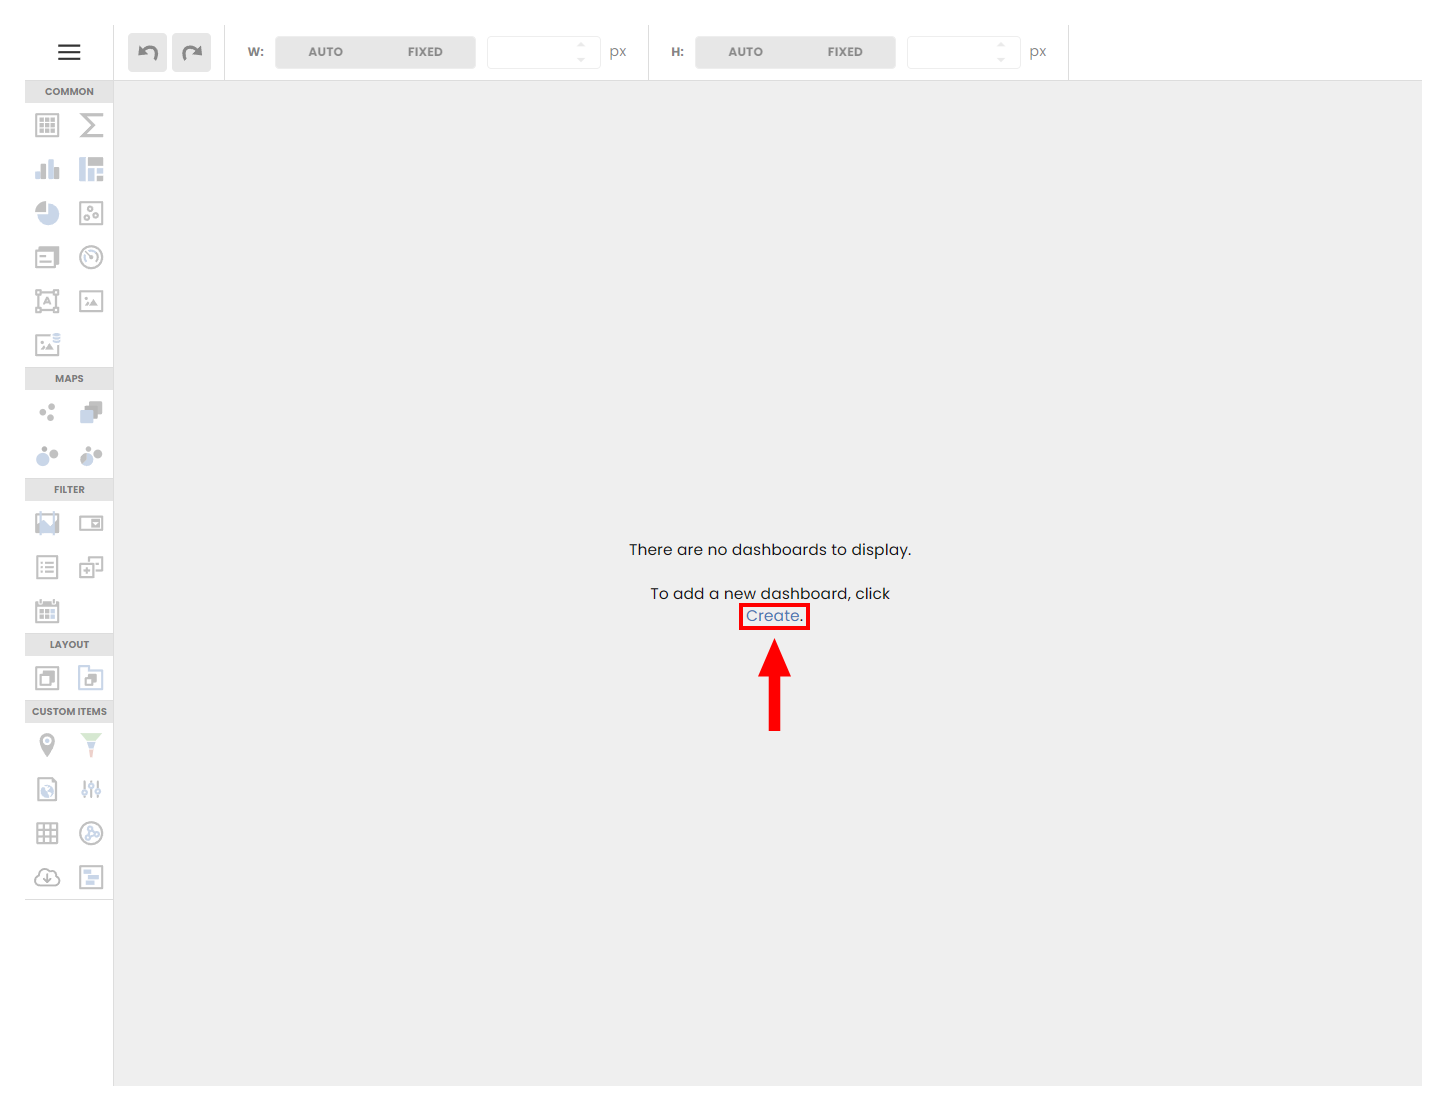
This brings you to the Dashboard Editor view. Click Create to begin a new dashboard.
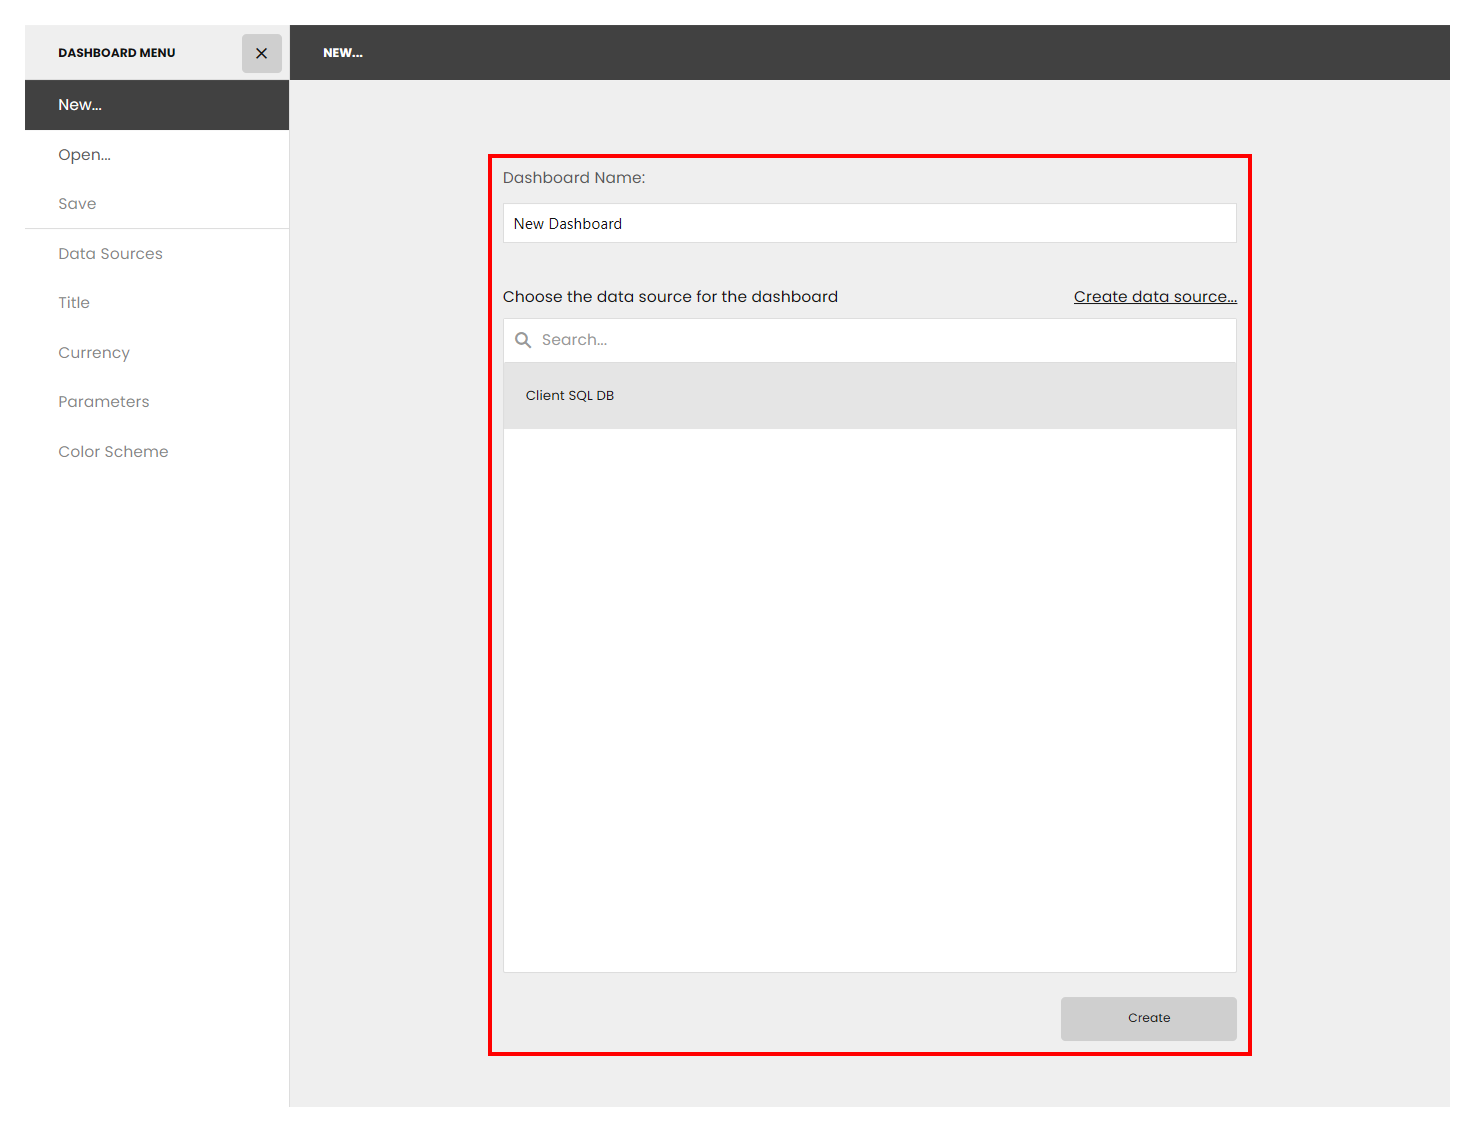
- Here you'll need to add both a Name and a Data Source for your dashboard.
-
Dashboard Name: Enter a name for your new dashboard. This helps in identifying and organizing your dashboards.
-
Add Data Source: Select Client SQL DB as your Data Source as this connects with all the modules and data within Compyl.
Binding Existing DataWe have a separate article breaking down how to create and bind blueprints to your data source so you have access to specific data sets to pull from here.
Adding Dashboard Items
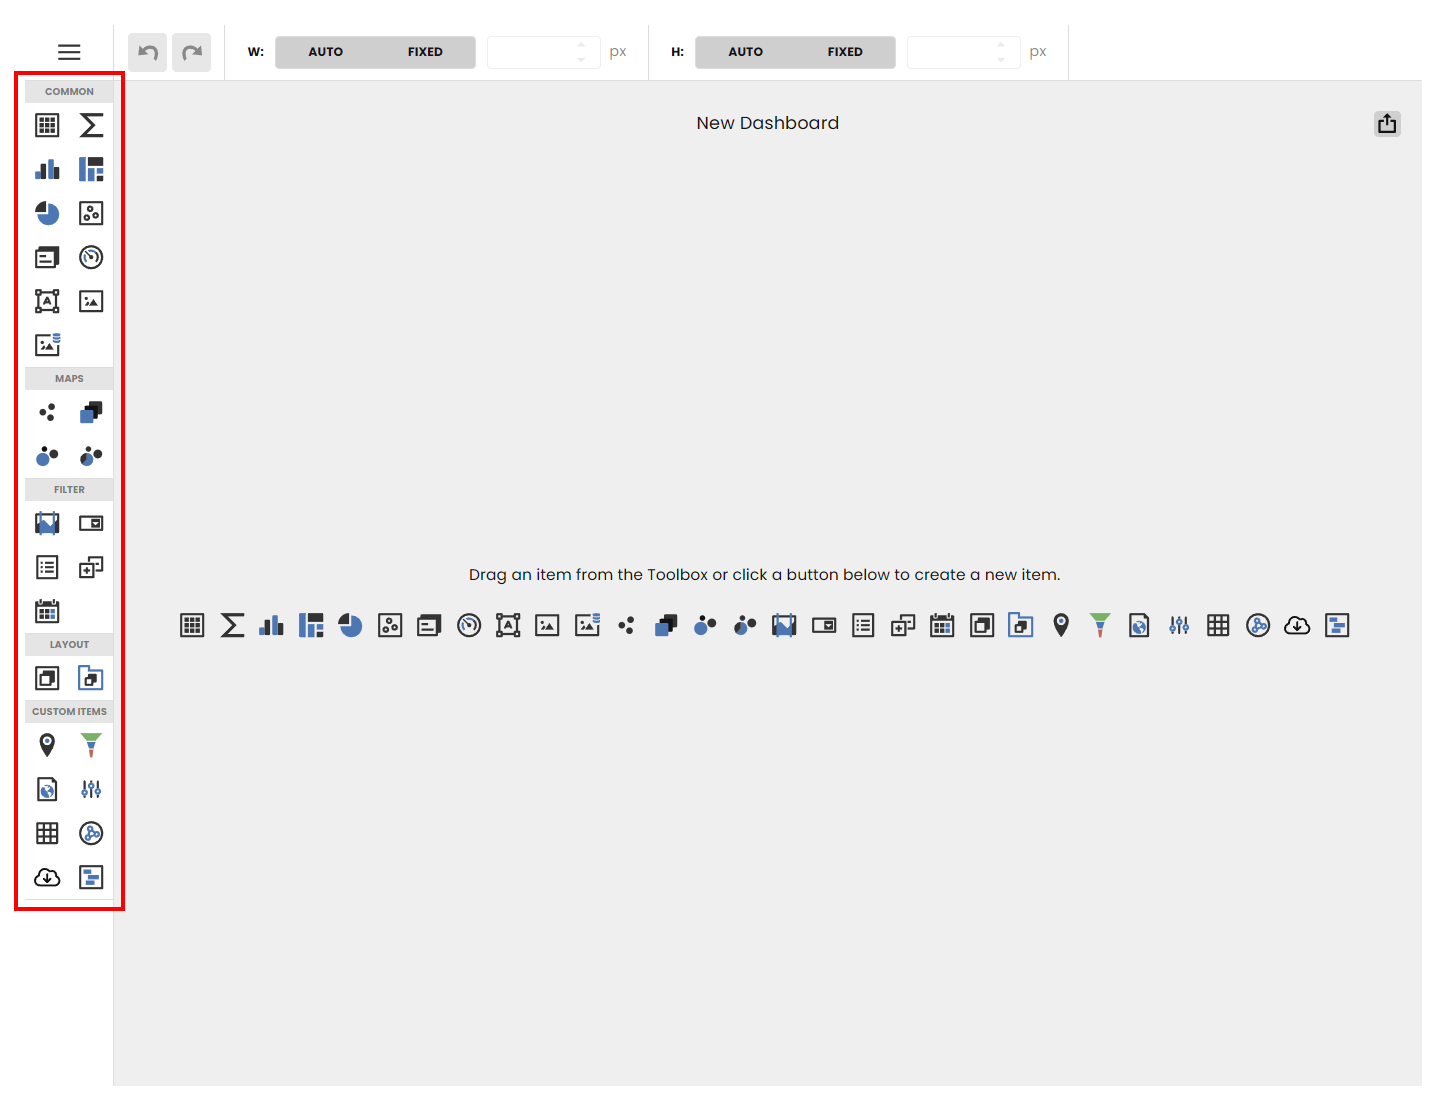
Once you've created your initial dashboard and named it, the next step is to add Dashboard Items and customize them to finalize your dashboard.
-
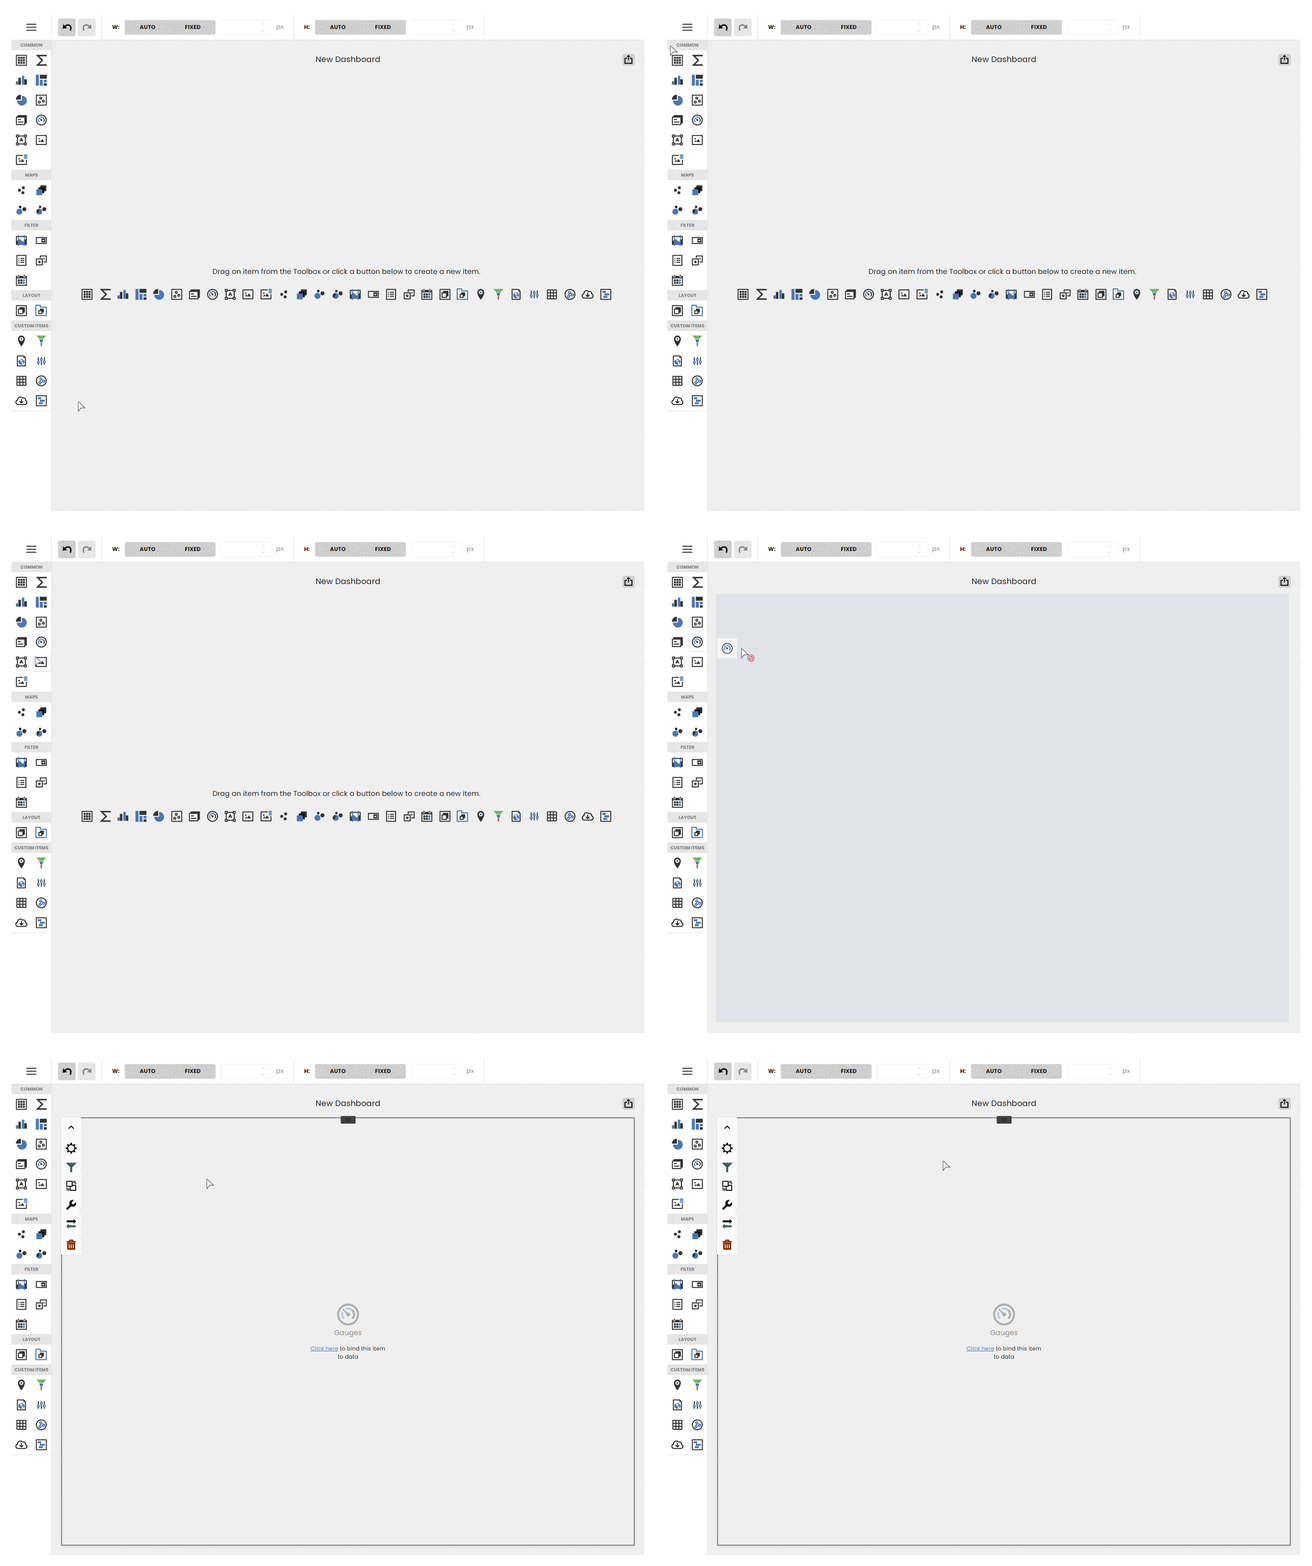
Add Items: Drag an item from the Toolbox on the left to add it to the field.
-
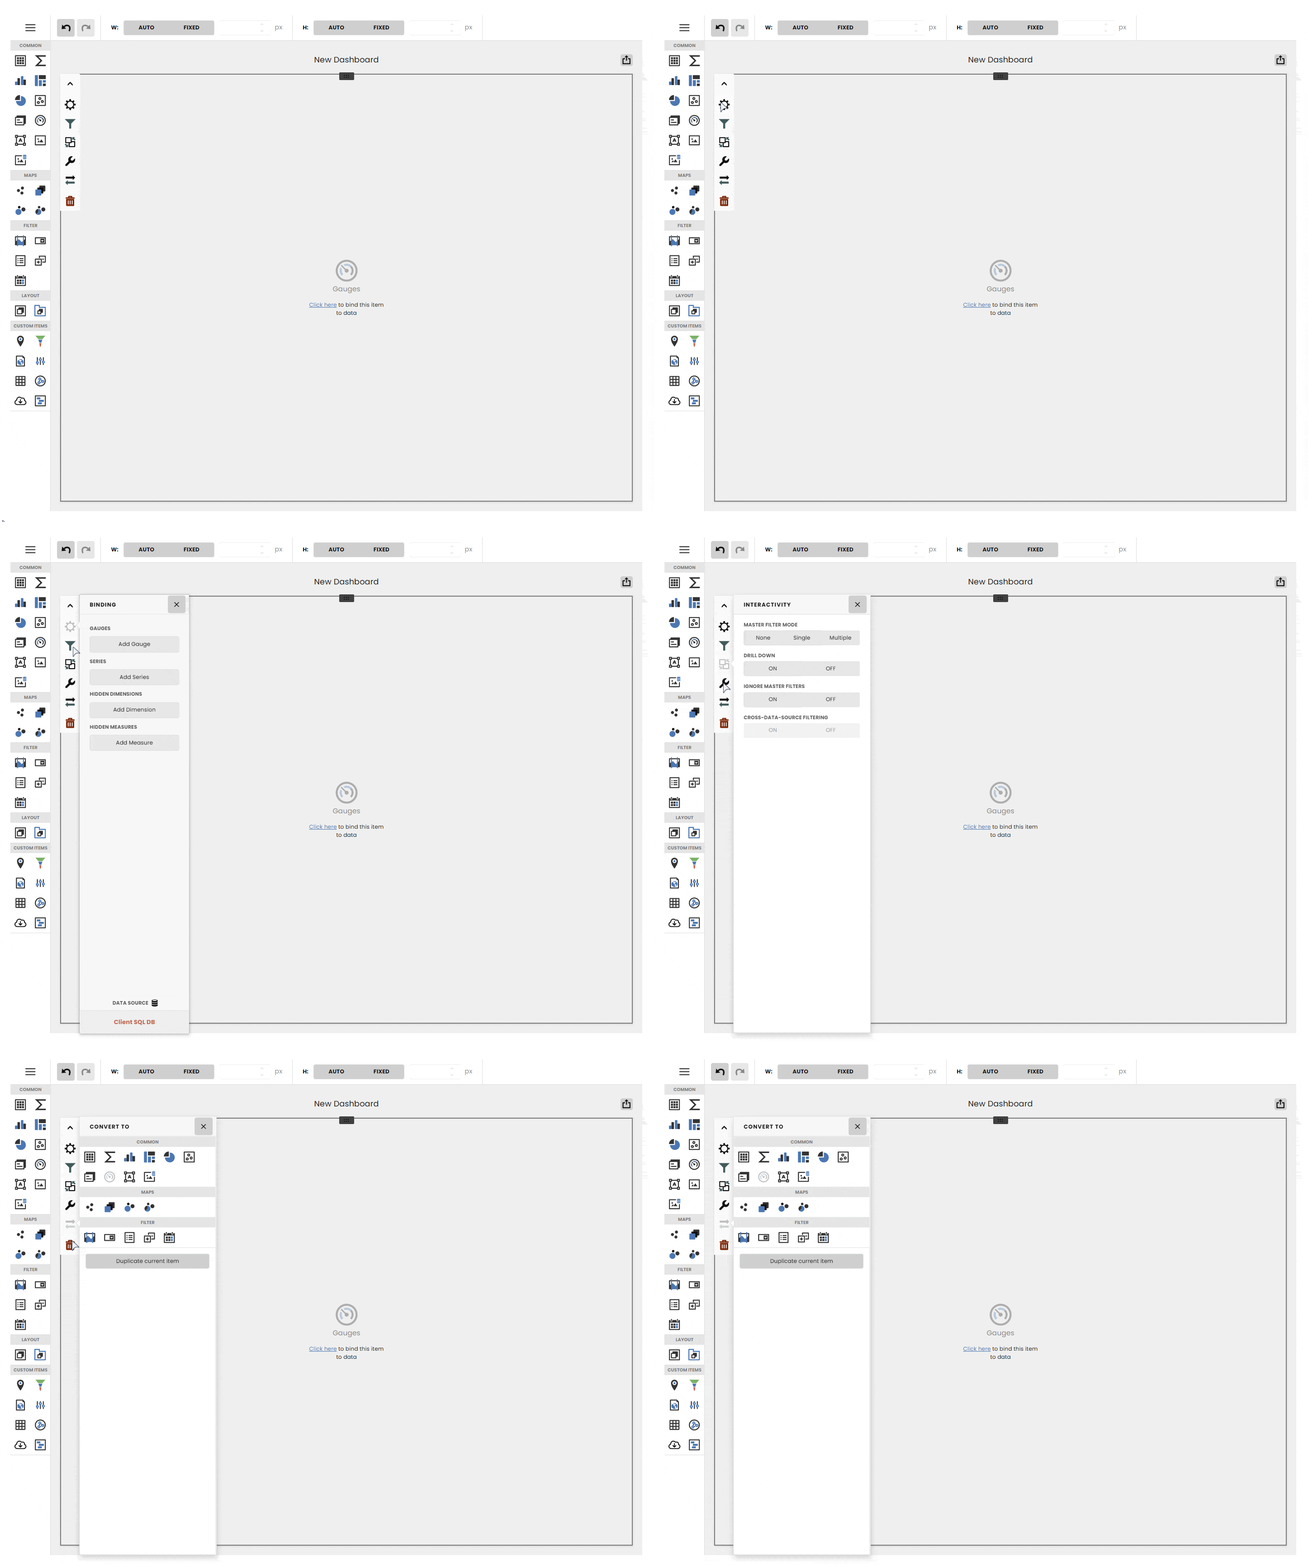
Configure Items: Customize the selected item by configuring its properties, such as the data fields to be used, aggregation methods, and visual styles.
Bind Data to Items
-
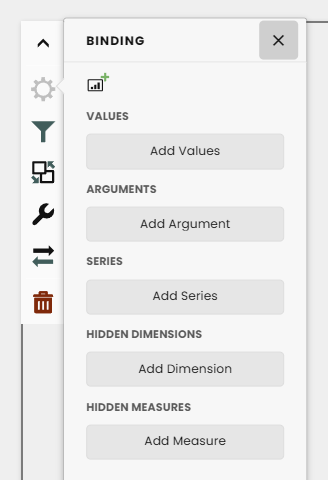
Data Binding: For each item, bind the data source fields to the item’s data properties. This involves selecting the fields that will be displayed in the item, such as columns for a grid or axes for a chart.
-
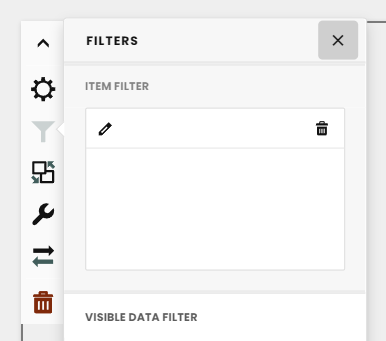
Set Filters: Apply filters to the data if needed, to focus on specific subsets of your data.
Customize Item Settings
-
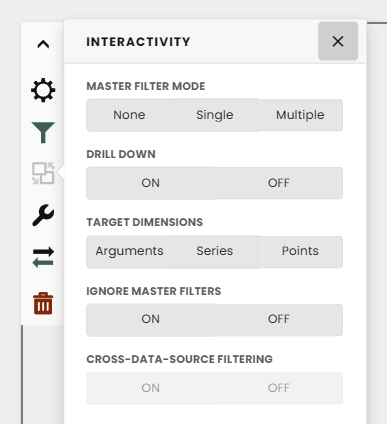
Interactivity: Enable interactivity features such as drill-down, filtering, and master-detail relationships between items.
-
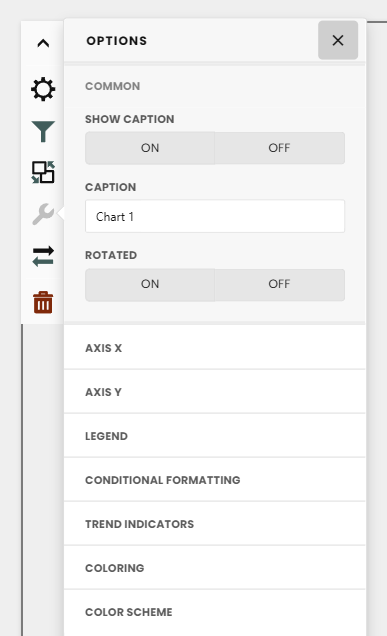
Appearance Settings: Adjust the appearance settings for each item, including colors, labels, and tooltips.
Arrange Dashboard Layout
-
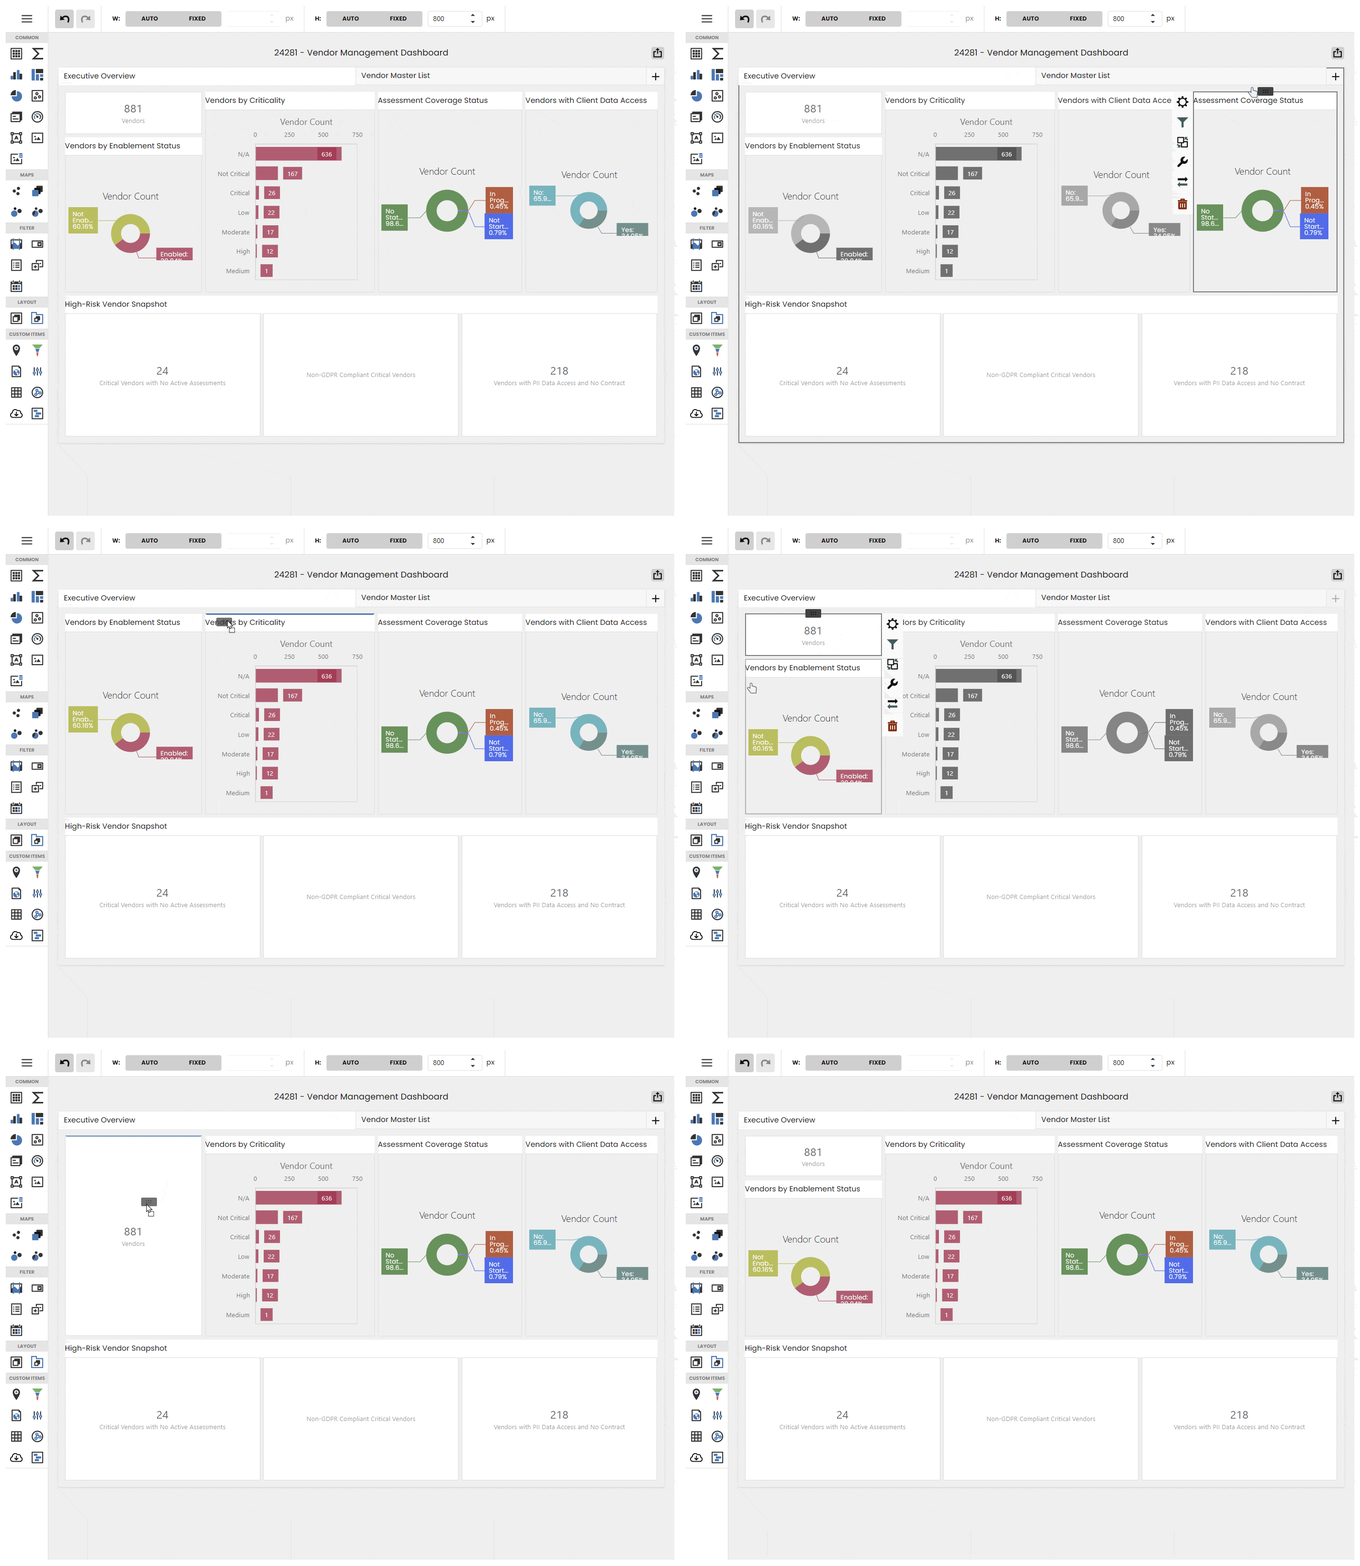
Drag and Drop: Use the drag-and-drop interface to arrange the items on your dashboard. Resize items to fit the layout and make the dashboard visually appealing.
Dashboard Menu
Click on the hamburger menu above the toolbar to bring up the following options:
New...: Start a new dashboard.
Open: Open an existing dashboard.
Save: Save your dashboard.
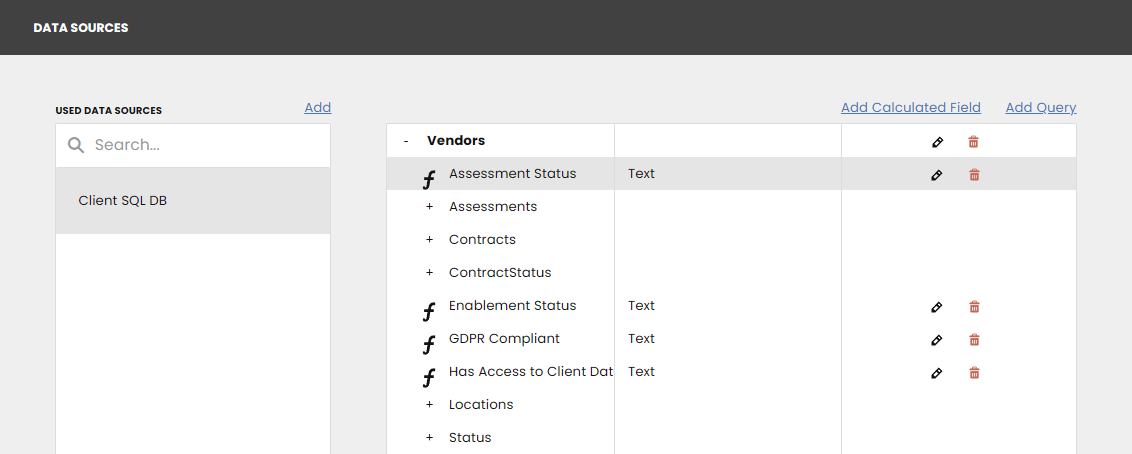
Data Sources: Add and/or Edit your data sources.
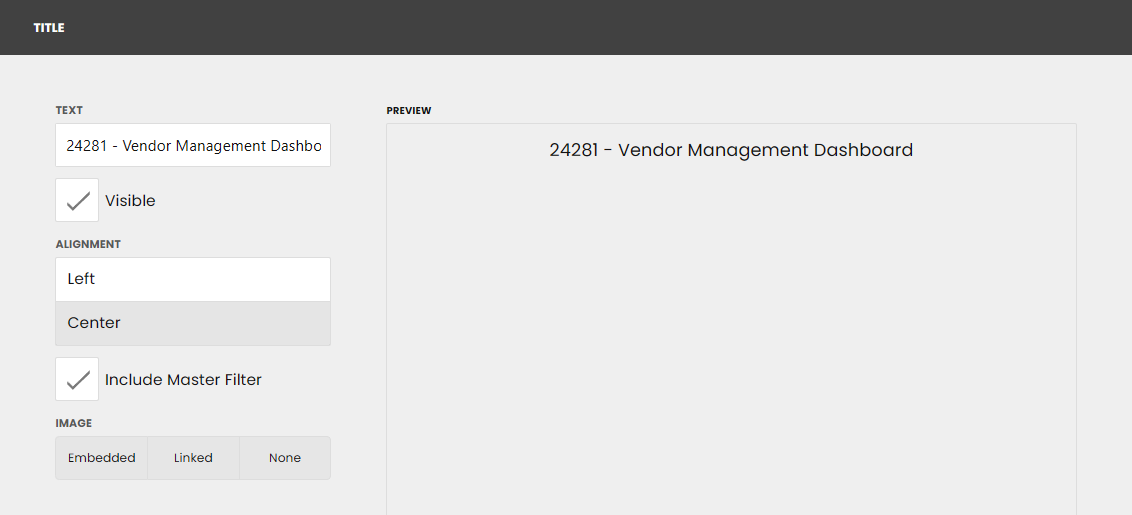
Title: Edit the title of your dashboard and how it's shown.
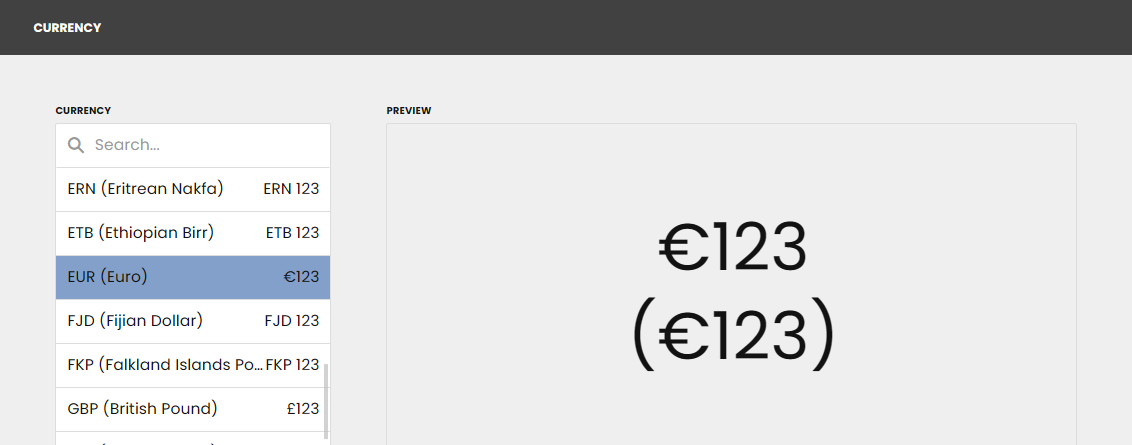
Currency: Set the locality of the currency (default is set to your instances settings).
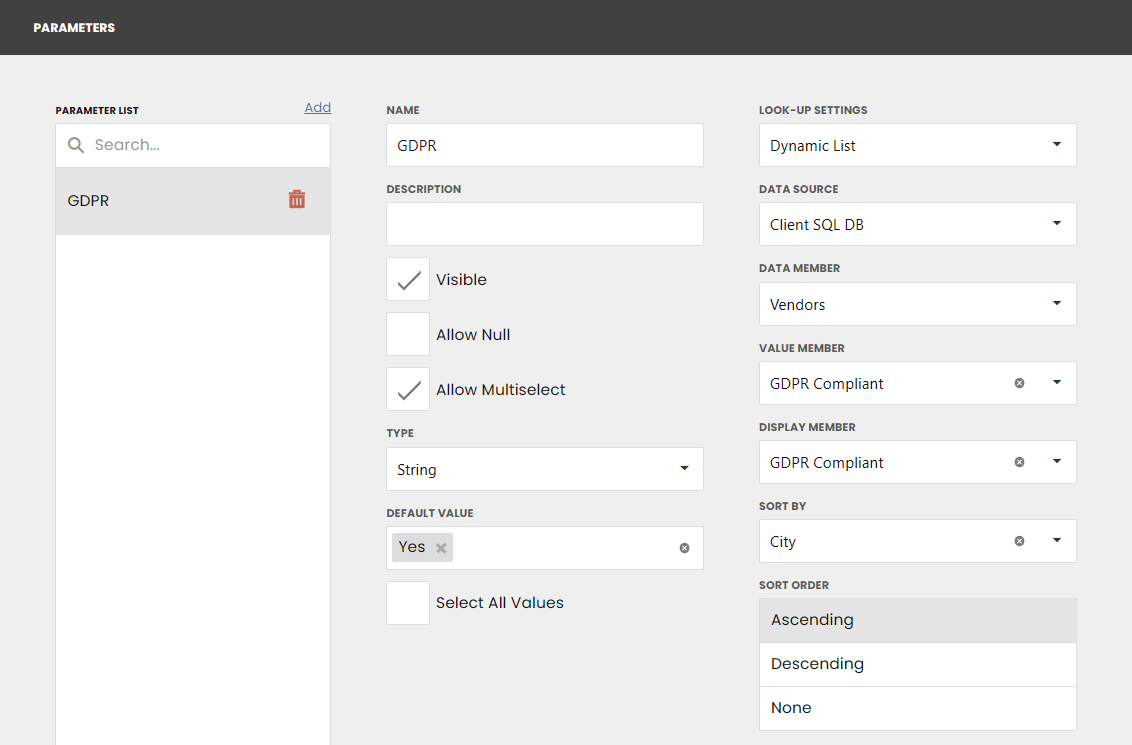
Parameters: Any additional parameters you wish to show. You can create, edit, and delete them here.
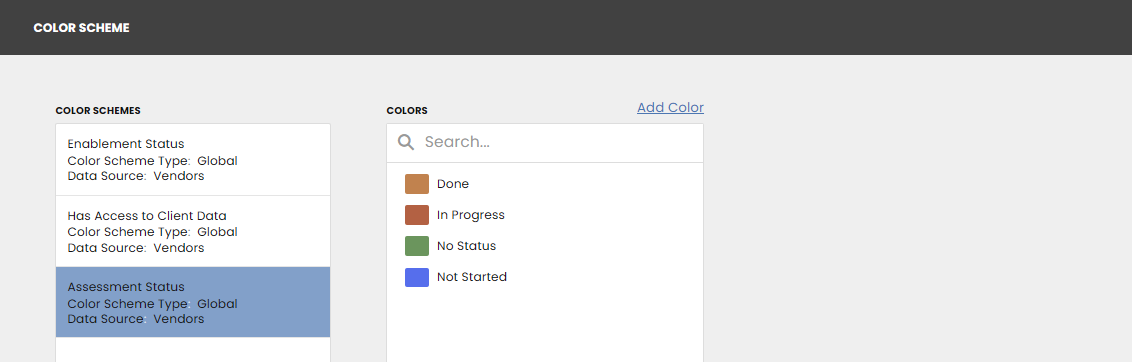
Color Scheme: Set the colors you wish to use for your tables, graphs, and charts.
Updated 2 days ago