
Report Wizard - Table and Vertical Report
Select Table Report/Vertical Report on the start page to create a table/vertical report and bind it to data.
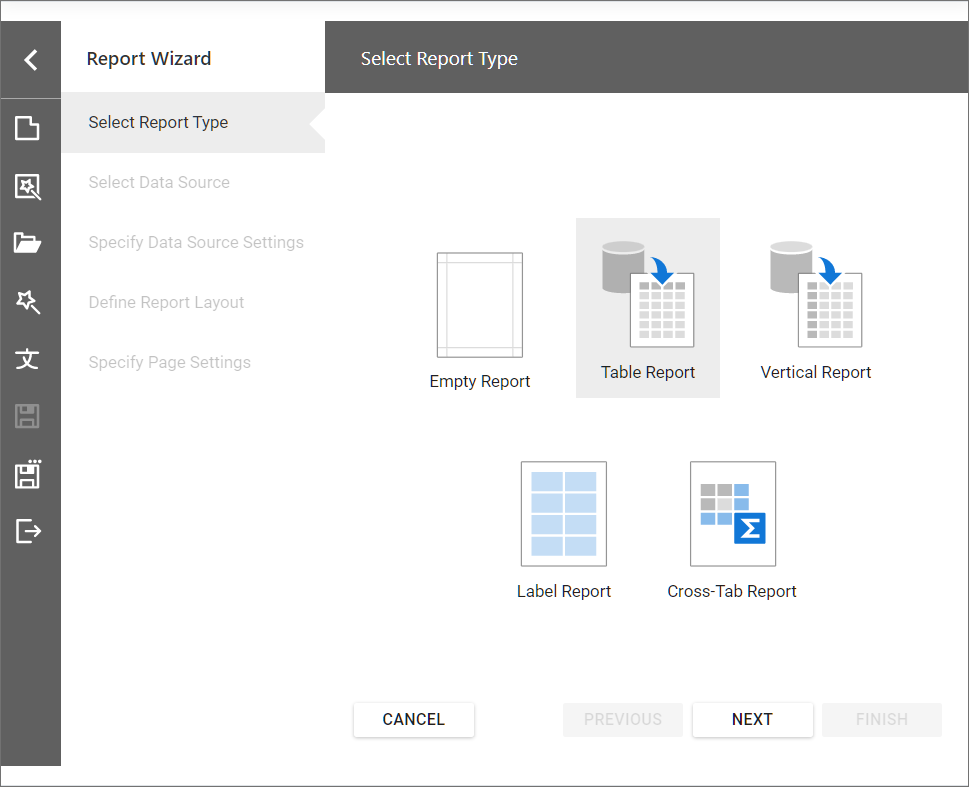
The wizard includes the following steps:
- Select Data Source
- Specify Data Source Settings (Database) / Specify Data Source Settings (JSON) / Specify Data Source Settings (Object)
- Define Report Layout (Table and Vertical Report)
- Specify Page Settings
Select Data Source
On this wizard page, you can select an existing data source or create a new data source.
Select an Existing Data Source
Select the first option and choose a data source from the list.
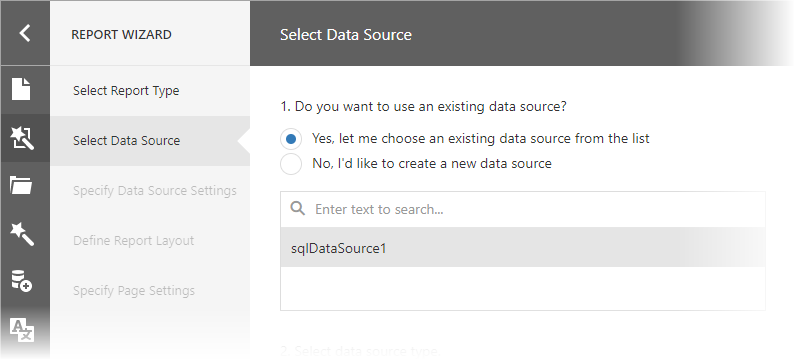
- If you create a new report, the list displays the Report Designer’s predefined data sources.
- If you edit an existing report, the list contains the Report Designer’s predefined data sources and data sources added to the current report with the Data Source Wizard.
If the report and Report Designer have data sources with identical names, this list displays the report’s data source.
Click Next to go to the Define Report Layout (Table and Vertical Report) page.
Create a New Data Source
Choose ‘No, I’d like to create a new data source’ and select the data source type.
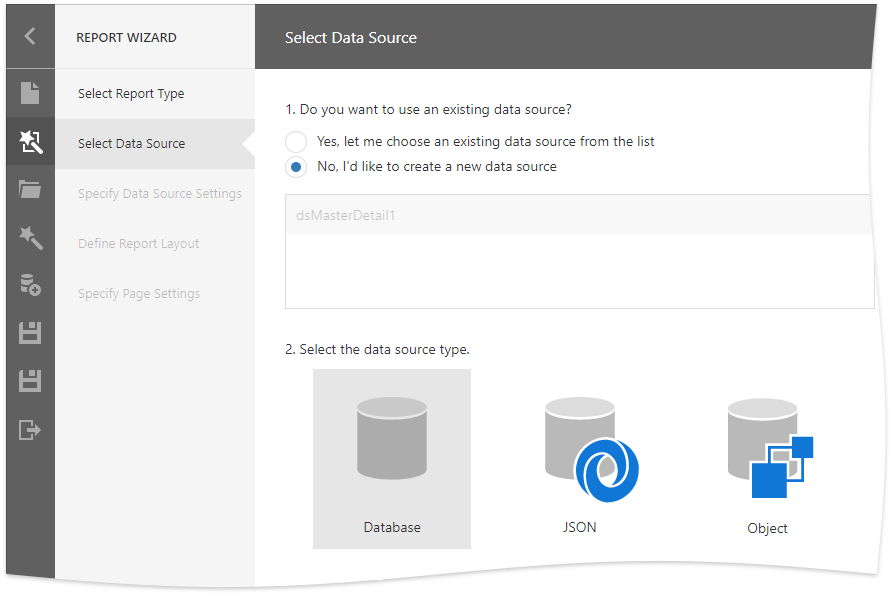
NoteYou can create new data sources only if you registered the corresponding data connections in the Report Designer.
- Specify Data Source Settings (Database) if you selected Database;
- Specify Data Source Settings (JSON) if you selected JSON;
- Specify Data Source Settings (Object) if you selected Object.
Specify Data Source Settings (Database)
This page appears if you selected Database in the previous section.
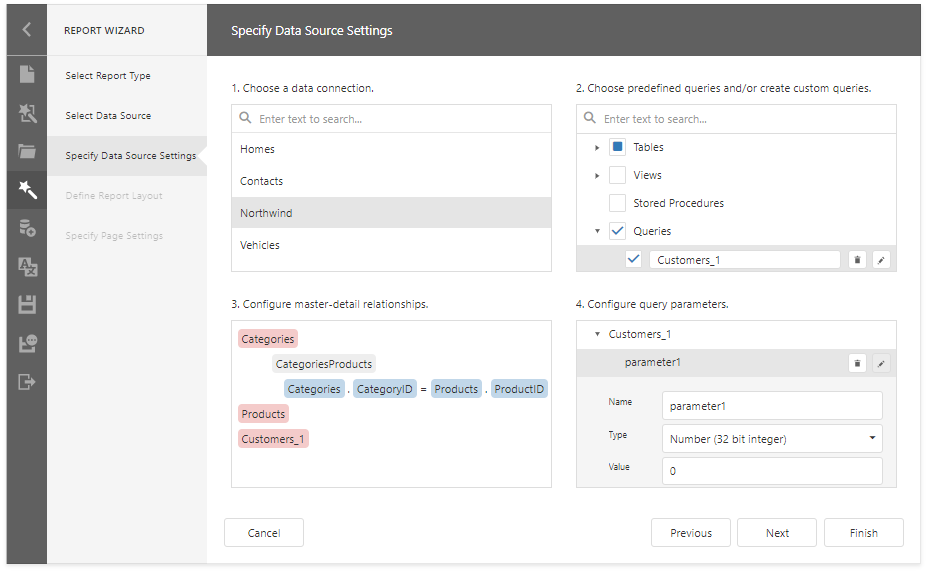
Choose a Data Connection
Select a data connection from the list.
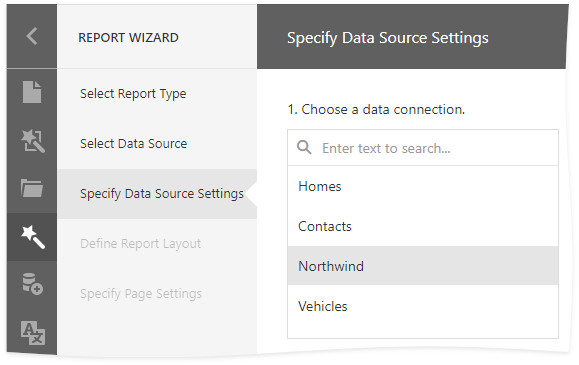
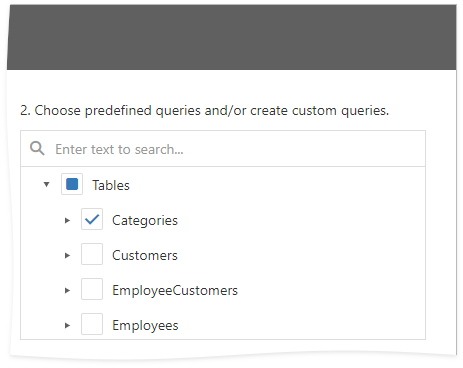
Choose Queries
Check tables, views and/or stored procedures to include them in a data source as separated queries.
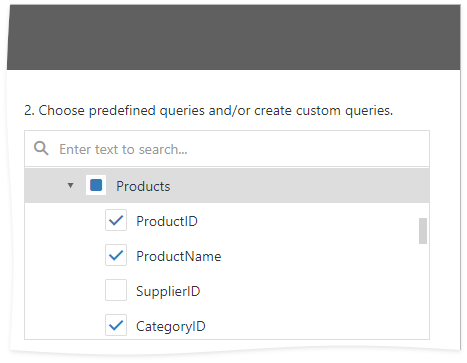
You can also check specific data fields.
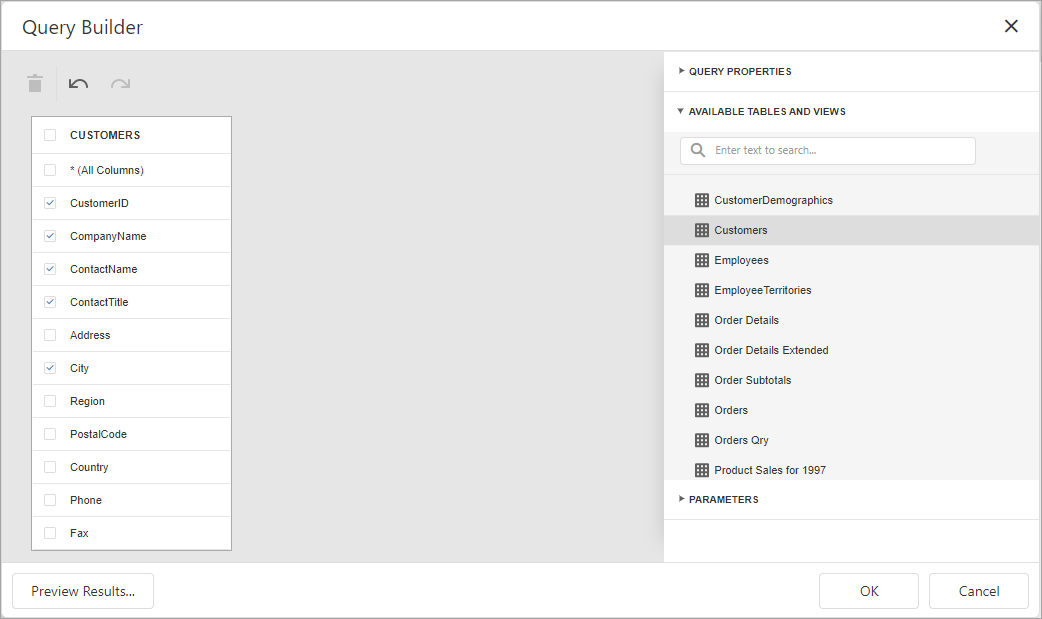
To join multiple data tables and shape the resulting data, click the Queries category’s plus button to invoke the Query Builder and create a custom query.
If you enabled custom SQL queries, the plus button invokes a context menu. You can choose whether to run the Query Builder or Custom SQL Editor.
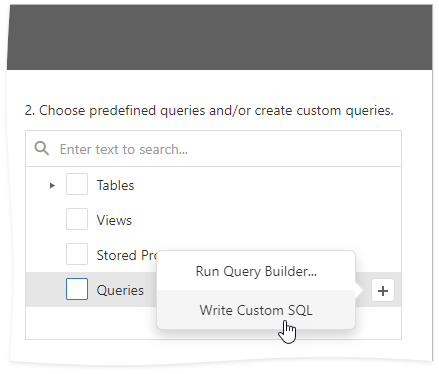
IMPORTANTEnable custom SQL queries only if you trust your users and environment. Make sure that you provide a secure query validation to protect your database. See General Security Considerations for more information.
You can click the  button to customize the query or the
  button to remove the query.
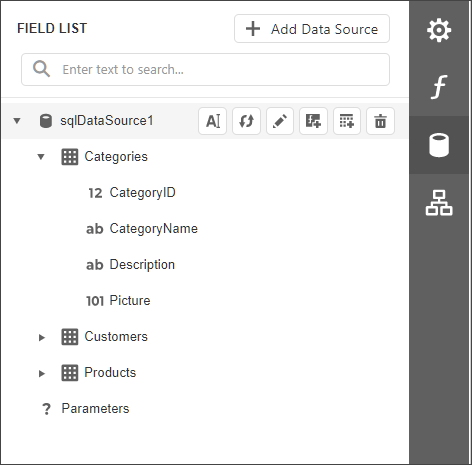
Once you finished the wizard, the data source becomes available in the Report Explorer‘s Data Sources node. The Field List reflects the data source structure.
Configure Master-Detail Relationships
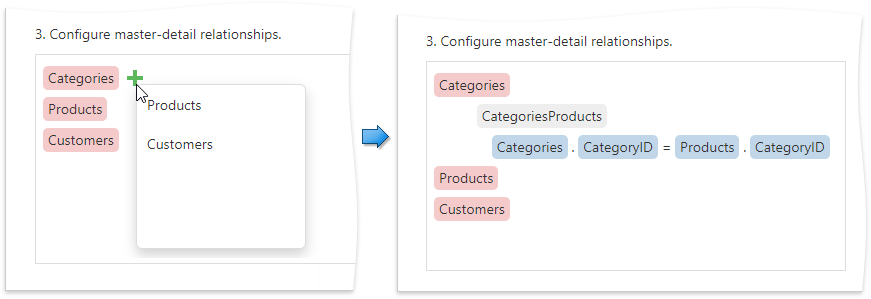
This step is available when you selected two or more queries.
To create a master-detail relationship, click the master query’s plus button, select the detail query in the invoked list, and connect the key fields.
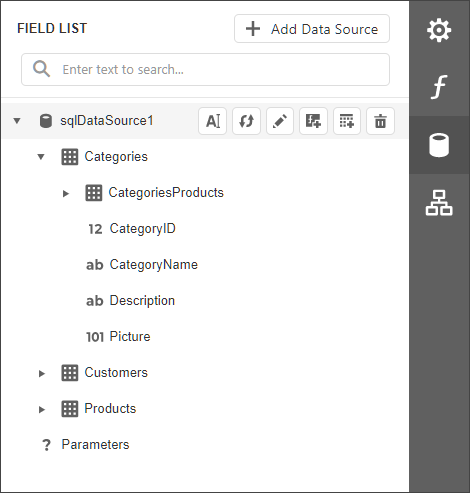
After the wizard is completed, the Field List reflects the master-detail hierarchy.
Configure Query Parameters
This step is available if you selected a parameterized stored procedure or created a custom query.
Select a query and click the plus button to add a new parameter.
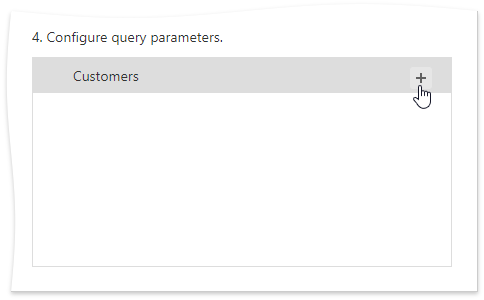
Click the  button to customize the parameter or the
  button to remove it.
You can use the following approaches to specify a parameter value:
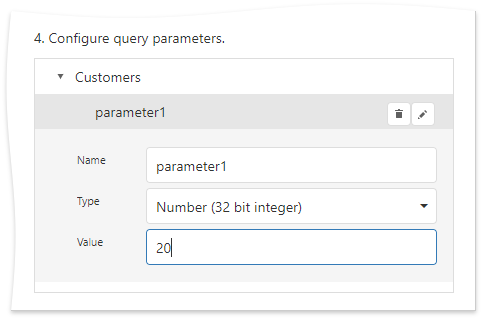
- Assign a static value
Select a query parameter’s type from the Type drop-down list and specify a value based on the selected type.
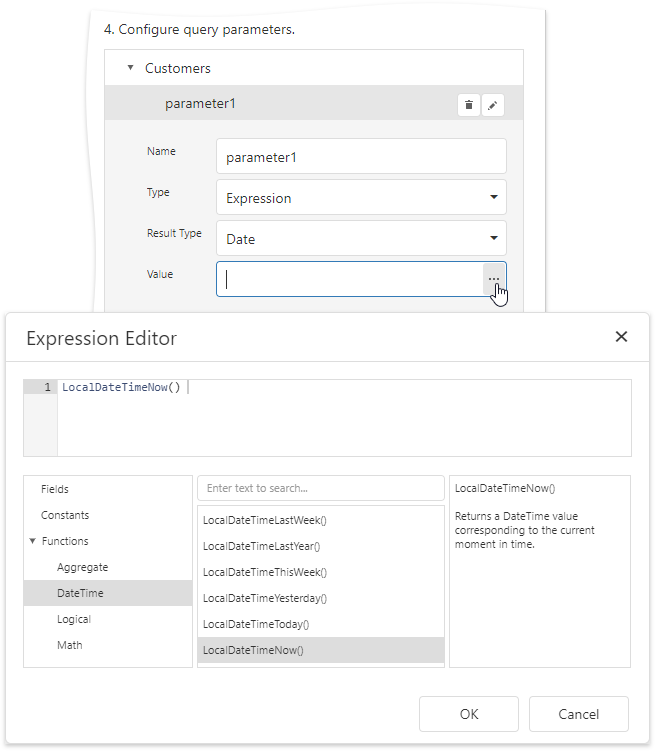
- Provide a dynamic parameter value
Set the Type option to Expression and specify the Result Type. Click the Value option’s ellipsis button and construct an expression in the invoked Expression Editor.
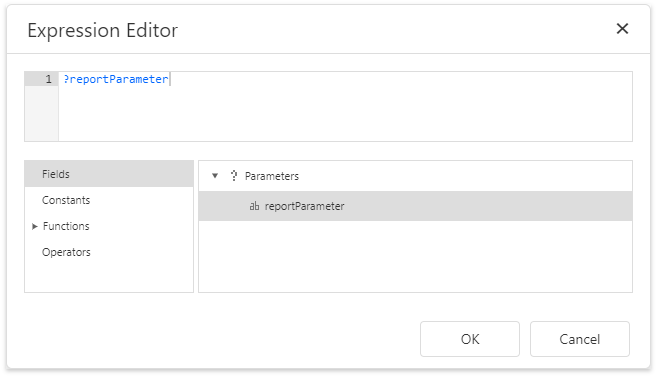
If you design the current report in the wizard, you can map a query parameter to an existing report parameter. To do this, use the ?parameterName syntax.
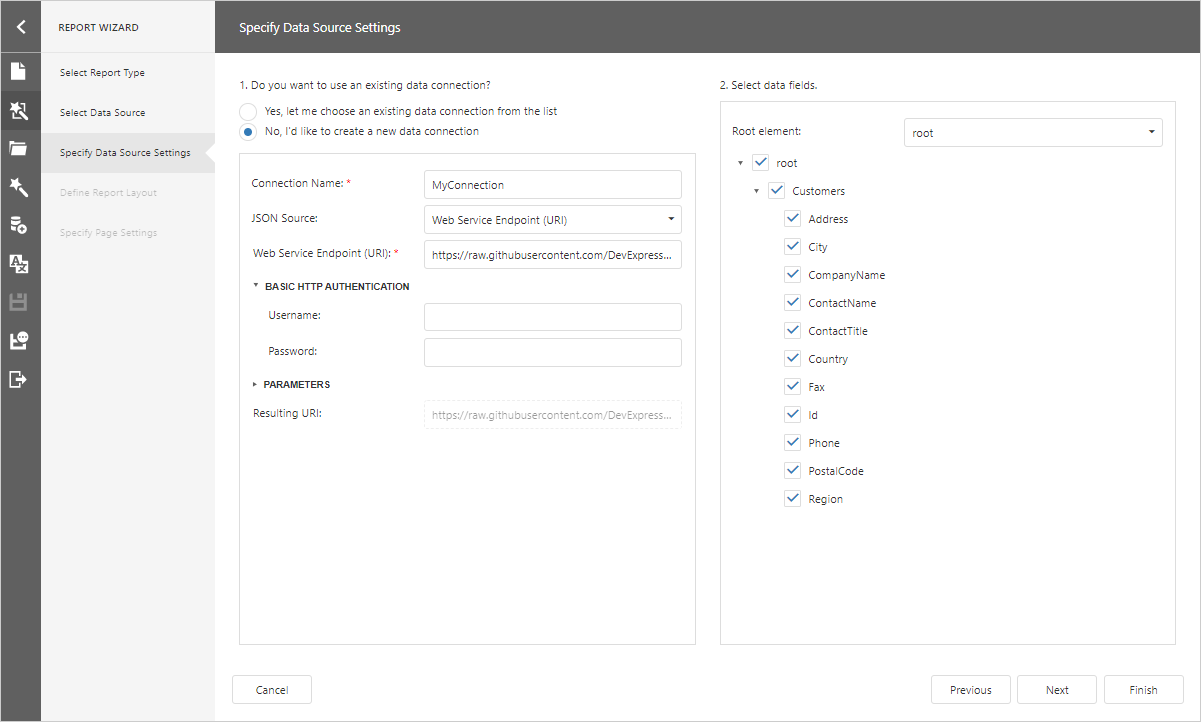
Specify Data Source Settings (JSON)
This page appears if you selected JSON on the previous section.
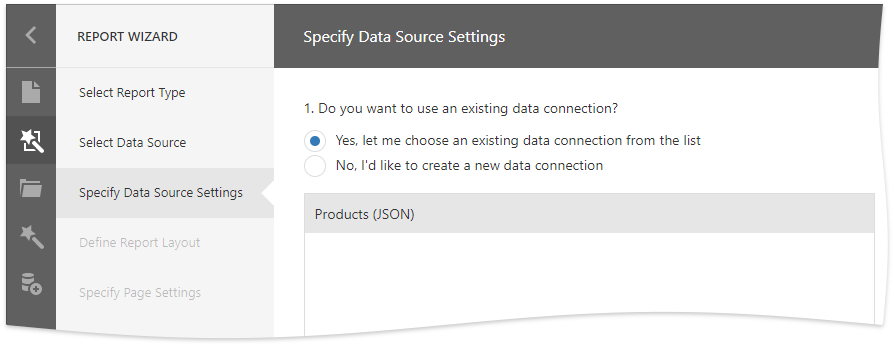
Select an Existing Data Connection
Select the first option and choose a data connection from the list.
Create a New Data Connection
Select the second option to create a new connection.
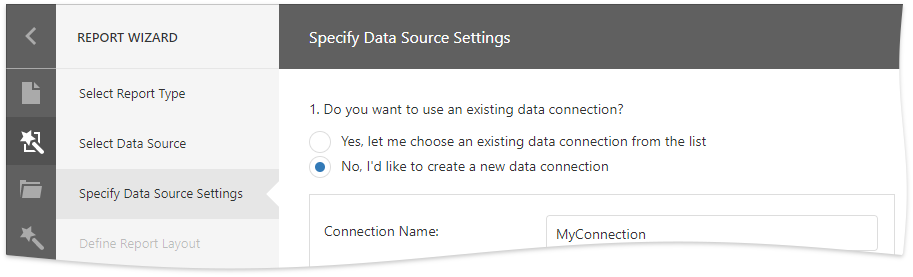
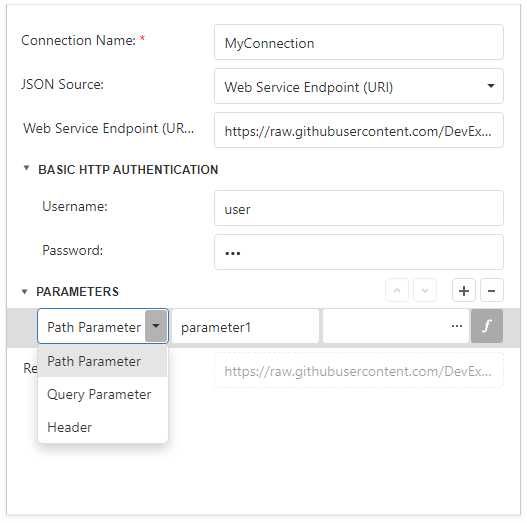
Specify the connection name and select the JSON source.
- Web Service Endpoint (URI)
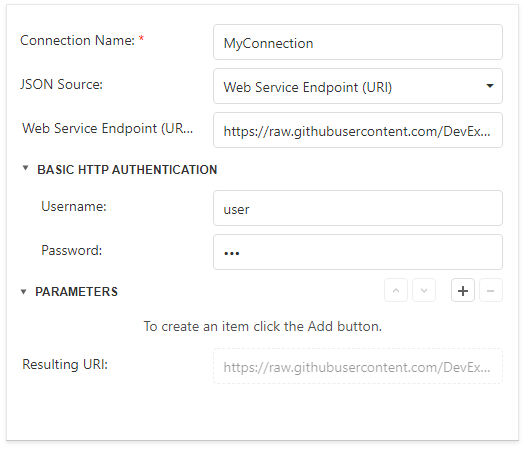
You can also specify the Web Service Endpoint’s request parameters (username and password, HTTP headers, or query parameters)
- JSON String
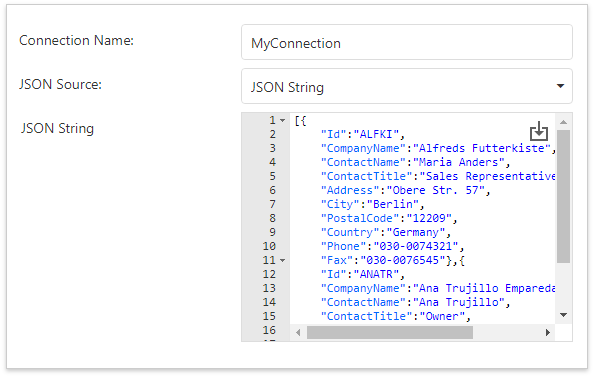
You can also click the Upload JSON button to load the JSON string from a JSON file.
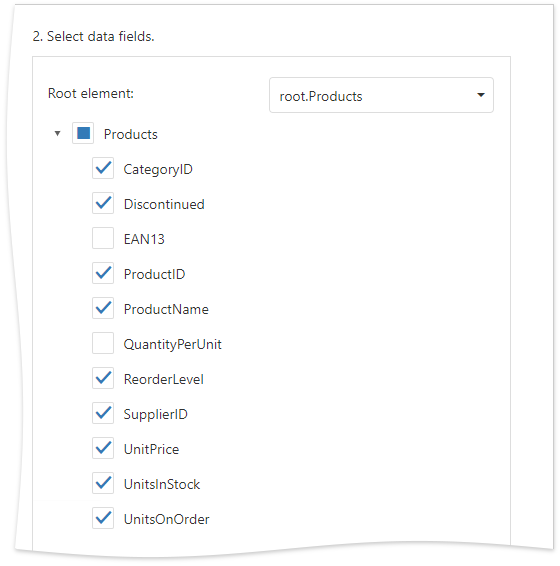
Select Data Fields
At this step, the wizard shows JSON schema. Check the data fields you want to include in your report.
Specify Data Source Settings (Object)
This page appears if you selected Object in the previous section.
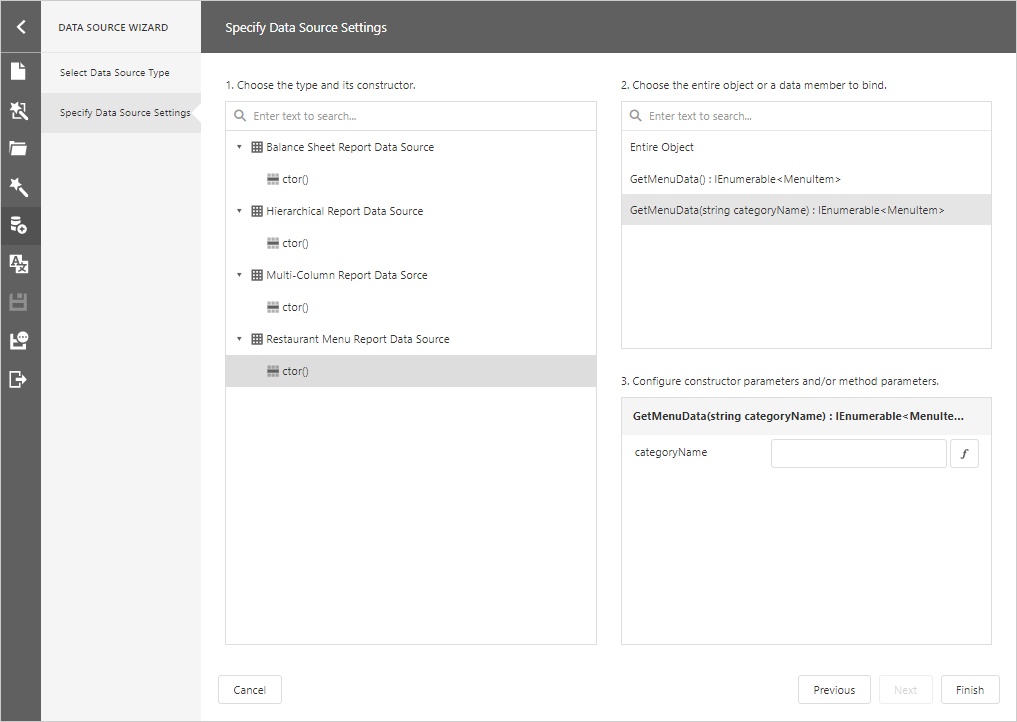
Choose an Object
Select a constructor from the list. The selected constructor creates an object data source.
Static classes do not have constructors. Select a class in this case.
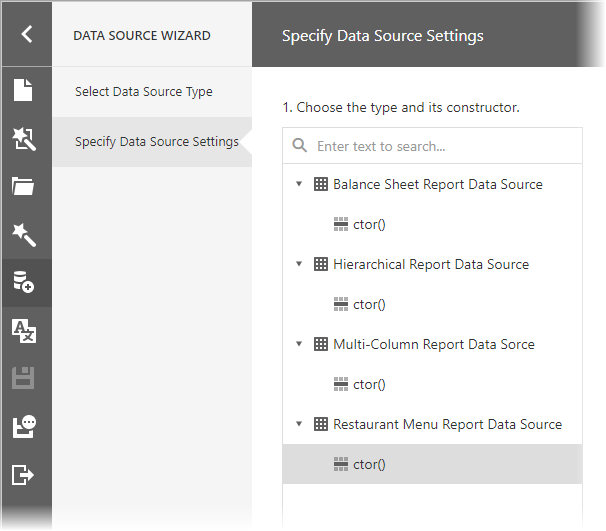
NOTEThe Data Source Wizard lists only the registered types. See Register Types for Object Data Source Wizard for details.
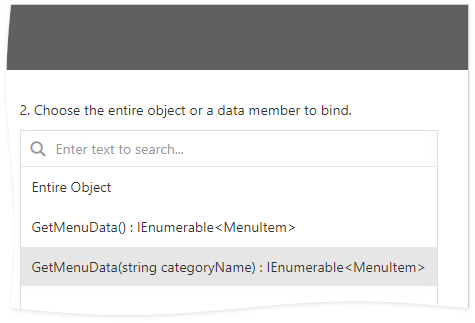
Choose a Data Member
Select the method that should provide data or select Entire Object to bind to the type’s fields.
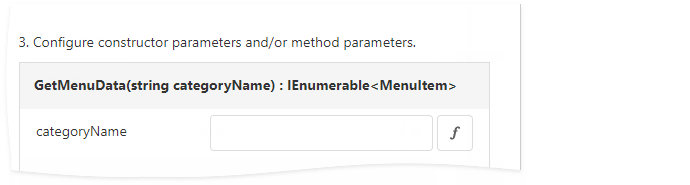
Configure Parameters
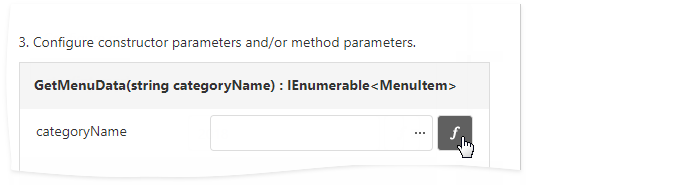
Specify constructor and/or data member parameters (optional).
You can use expressions to provide data source parameter values. Click the  button to switch the parameter’s editor to the expression mode. Specify an expression in the parameter’s editor or click the parameter’s ellipsis button to launch the Expression Editor. You can use report parameters in expressions to specify an input value for a data source parameter.
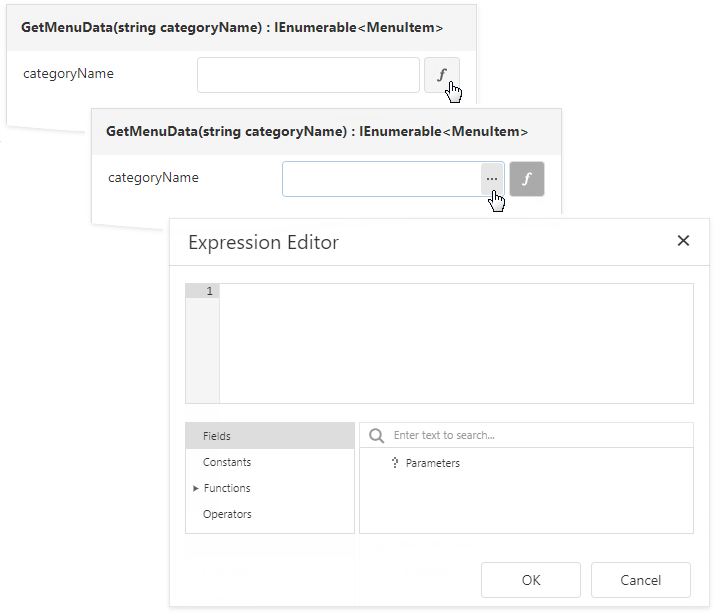
To return to the value mode, click the  button again.
SEE ALSO
Bind a Report to an Object Data Source
Define Report Layout (Table and Vertical Report)
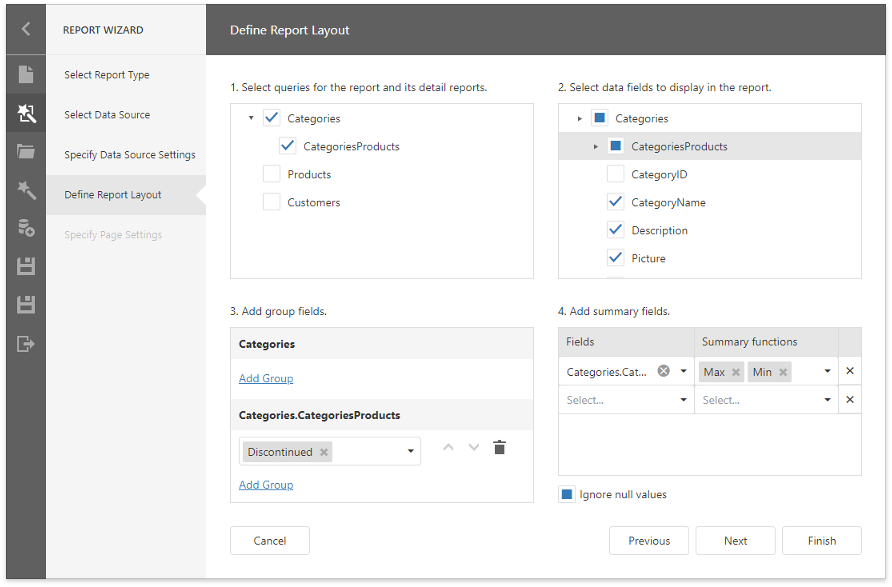
In this section, you can specify options to generate the report layout.
Select Queries
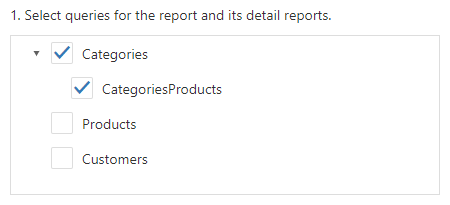
Select queries for the report and its detail reports. If you selected the Table Reportand bound it to a database, the query list can also contain master-detail relationships.
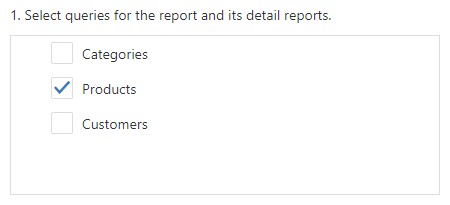
- If you select one query, the wizard assigns it to the report’s XtraReportBase.DataMember property.
- If you select two or more queries, the wizard creates the Detail Report Band for each query at the same hierarchical level and assigns the band’s DataMember property to the corresponding query.
- If you select a master-detail relationship, the wizard creates the Detail Report Band under the corresponding master report and assigns the band’s DataMember property to this relationship’s name.
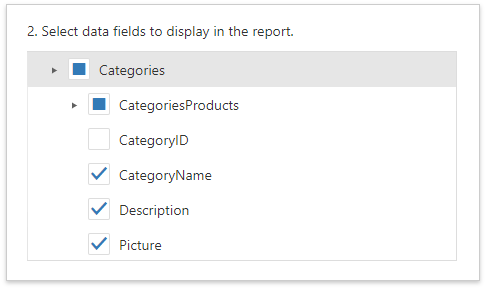
Select Data Fields
Choose data fields from the selected queries to display them in the report.
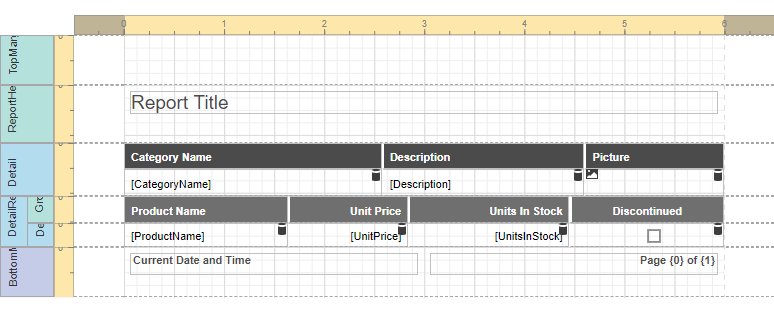
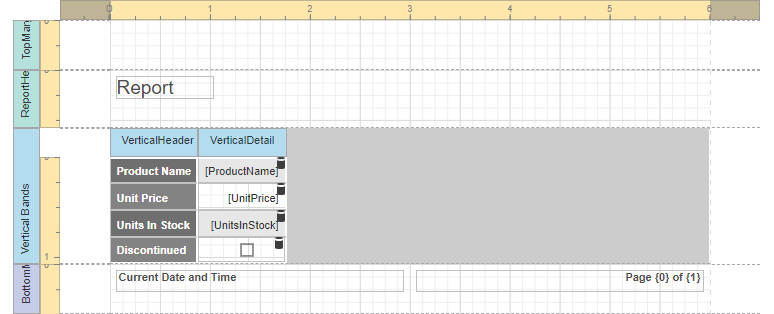
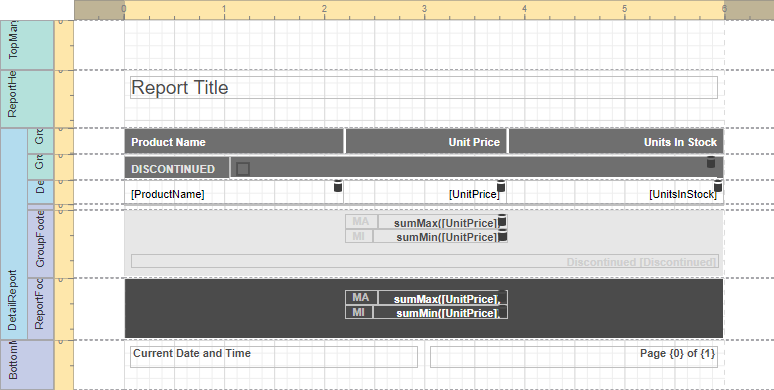
Click Finish if you do not need to group fields and/or display summaries. The created report looks similar to the image below.****
Add Group Fields
Click the Add Group button and select data fields in the drop-down list.
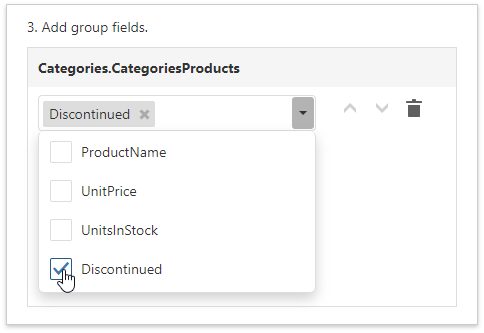
Use arrow buttons to change the group order.
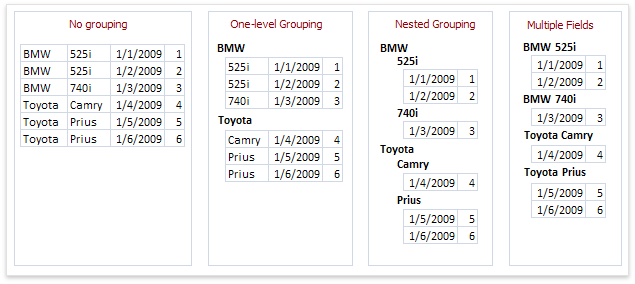
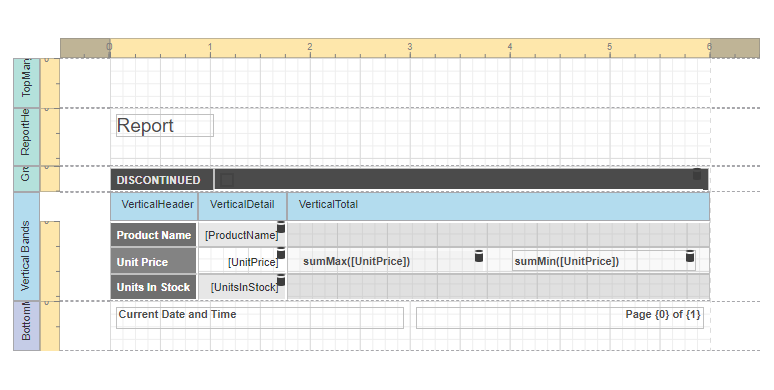
The following image demonstrates group types:
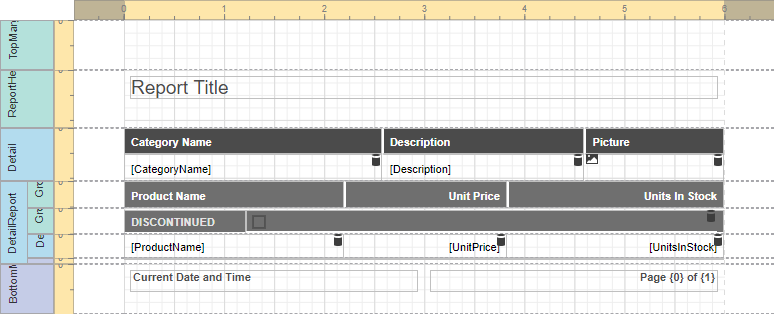
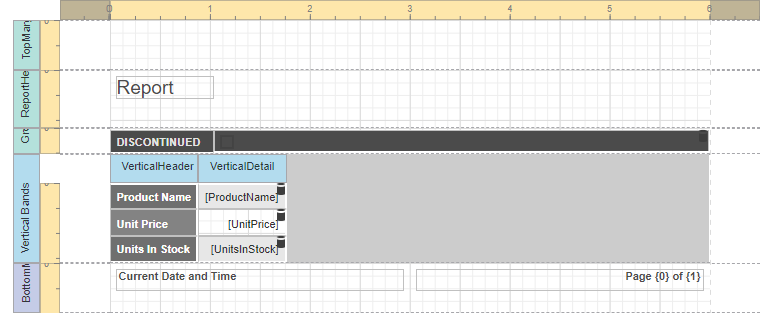
You can stop the wizard at this step and get the report layout similar to the image below.
Add Summary Fields
To add a summary, select a data field (numeric, date-time or Boolean) and summary function(s).
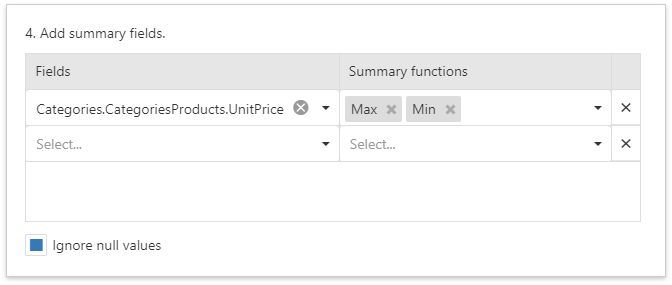
- Table Reports display summaries in the Report Footer an Group Footers.
- Vertical Reports display summaries in the Vertical Total band.
Select the Ignore null values checkbox to do not take data fields’ empty values into account. Otherwise, these values are treated as zeros for numeric and Boolean fields and the earliest system date is used for date-time fields.
Specify Page Settings
This wizard section allows you to set up the report’s page.
Specify Page Settings
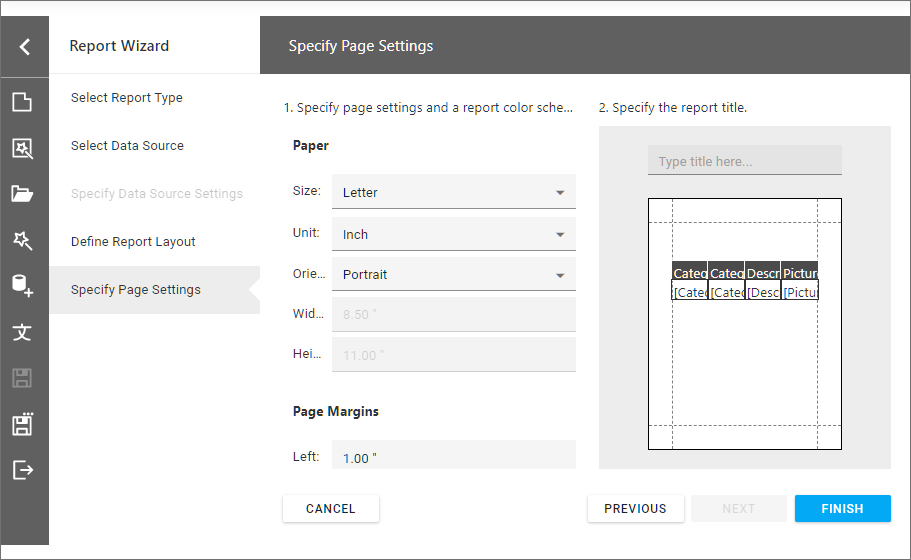
You can specify the following report properties:
- Size (
XtraReport.PaperKind) - Unit (
XtraReport.ReportUnit)
Choose between Inch, Millimeter, and Pixel to specify size options at this step. After you finish the wizard, the Report Designer transforms the specified units to HundredthsOfAnInch, TenthsOfAMillimeter, or Pixels. - Width and Height
(XtraReport.PageWidthandXtraReport.PageHeight)
These properties are read-only until you set the Size option to Custom. - Page Margins (
XtraReport.Margins) - Orientation (
XtraReport.Landscape)
The wizard’s right-hand side shows the page preview based on the specified settings.
After you complete the wizard, you can change these settings in the Report Designer’s Properties Panel.
Specify a Report Color Scheme
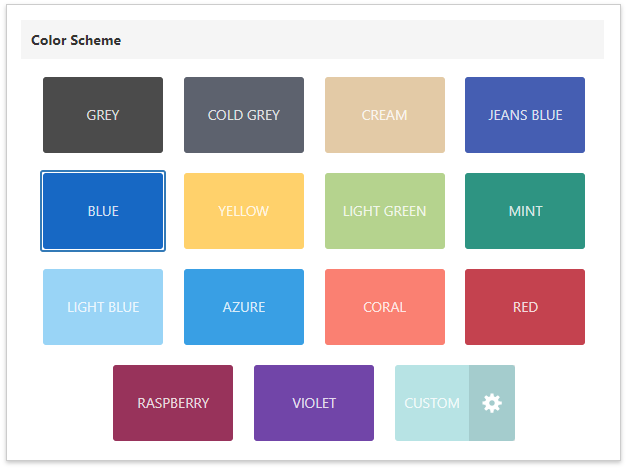
Scroll down the Specify Page Settings page to the next section that allows you to select the report’s color scheme. The wizard creates report styles based on the selected color for the first-level report controls and applies styles with more transparent colors to controls at deeper levels.
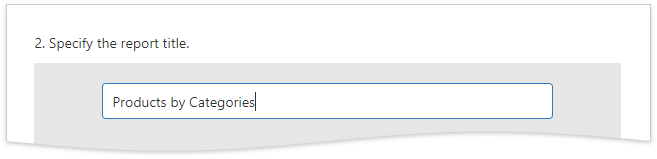
Specify the Report Title
Click the placeholder and enter the report title.
Updated 7 months ago