
Linking Dashboard Items
To visualize data, dashboard items need to be linked to data source fields. This section explains the process of binding data to these items.
-
Binding Dashboard Items to Data in the Web Dashboard UI
This topic explains how to bind newly created dashboard items to data source fields to visualize your data. For an overview of common concepts, see the Add and Bind Dashboard Itemshelp topic.
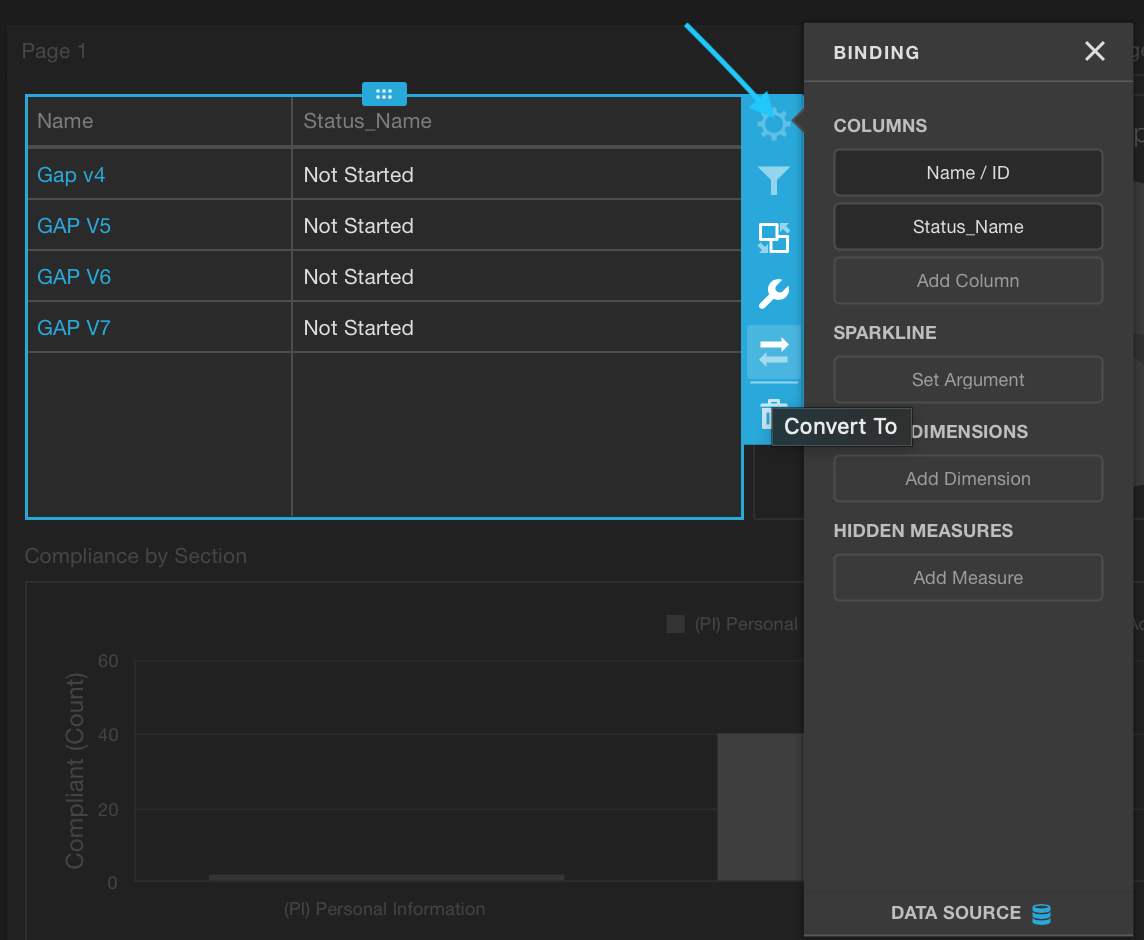
Create BindingAccess the Binding MenuOpen the Binding menu. The image below shows a Grid dashboard item bound to an SQL Data Source | Sales Person query:
 Select Data Source Field
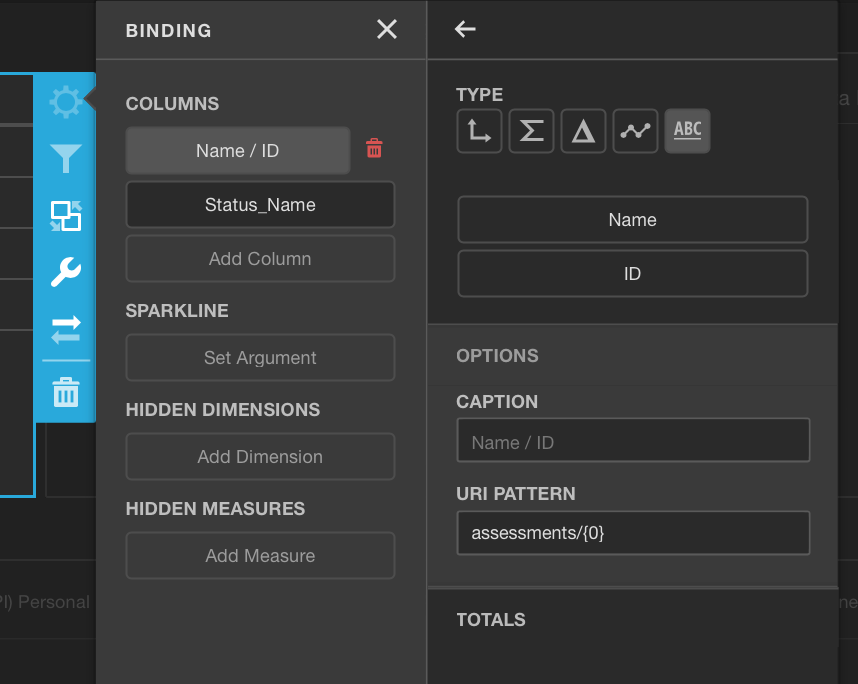
Click on a placeholder and choose the data source field to bind the dashboard item to data:
 Rename Data Item Caption
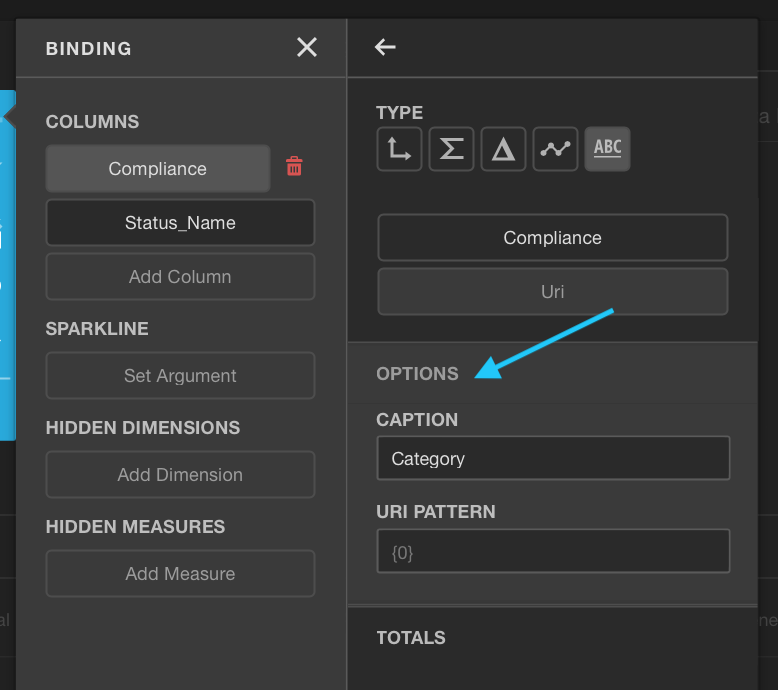
To rename the data item’s caption, go to the data item’s Options section:
Tip: For information on how to bind a specific dashboard item to data, refer to the Data Provision help topic for dashboard items.
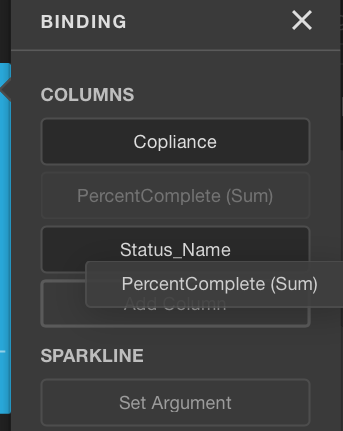
Modify BindingChange Data Binding OrderUse drag-and-drop to rearrange the data binding order:
 Clear BindingRemove Data Item
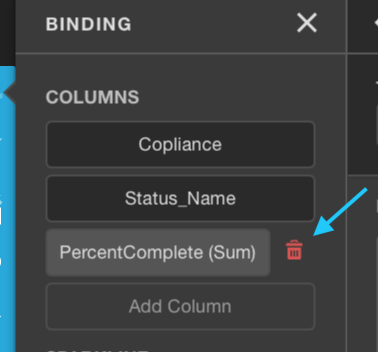
To remove a data item, select it and click the Remove button (🗑️) next to the data item:
 Specify a Data SourceChange Default Data Source
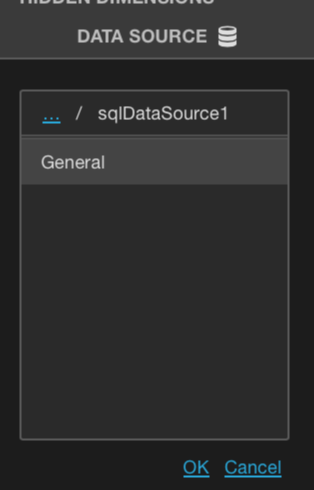
A dashboard can have multiple data sources. To change the default data source (or query/data member), access the dashboard item’s Binding menu and click the Data Source button:
 Update Data Source
In the invoked section, select the new data source (or query/data member) and click OK.
When you change the dashboard item’s data source, data items attempt to display data from the same column of the new data source. If such a column does not exist, a red indicator will appear for this data item. Select a new data source field for the item.
-
Hidden Data Items
Hidden data items can be used to perform various data shaping and analysis operations using measures or dimensions that do not directly appear in the visual representation of data.
Adding Hidden Data ItemsSteps to Add Hidden Data Items- Access the Binding Menu: Open the Binding menu.
- Add Measures/Dimensions: Click the "Add Measure" or "Add Dimension" placeholders in the Hidden Measures/Hidden Dimensions section and select the appropriate data field.\
Operations Using Hidden Data ItemsFilteringHidden dimensions can be used to filter dashboard items and measures. For instance, in the image below, the Grid is filtered by the hidden dimension OrderDate (Quarter):
SortingYou can sort values of a specified dimension using a hidden measure. The image below shows sorting by the hidden measure UnitPrice (Sum):
Top NHidden measures can be applied in Top N conditions. The example below displays the top 5 categories for the hidden measure UnitPrice (Sum):
Conditional FormattingFormat rules based on hidden measures can be created to apply conditional formatting to elements corresponding to visible values. The image below shows a Range Set format rule calculated by the hidden measure Quantity (Sum):
By using hidden data items in Compyl, you can enhance your data analysis capabilities through advanced filtering, sorting, Top N conditions, and conditional formatting. For more detailed information and assistance, consult the Help Center or contact Compyl customer support.
-
Connecting Dashboard Items to Data in OLAP Mode
Updated 7 months ago